Graphics
Time Loop
Looping animations that explore the essence of time. Cyclical motion that folds back on itself and never quite ends.
My Month in Numbers
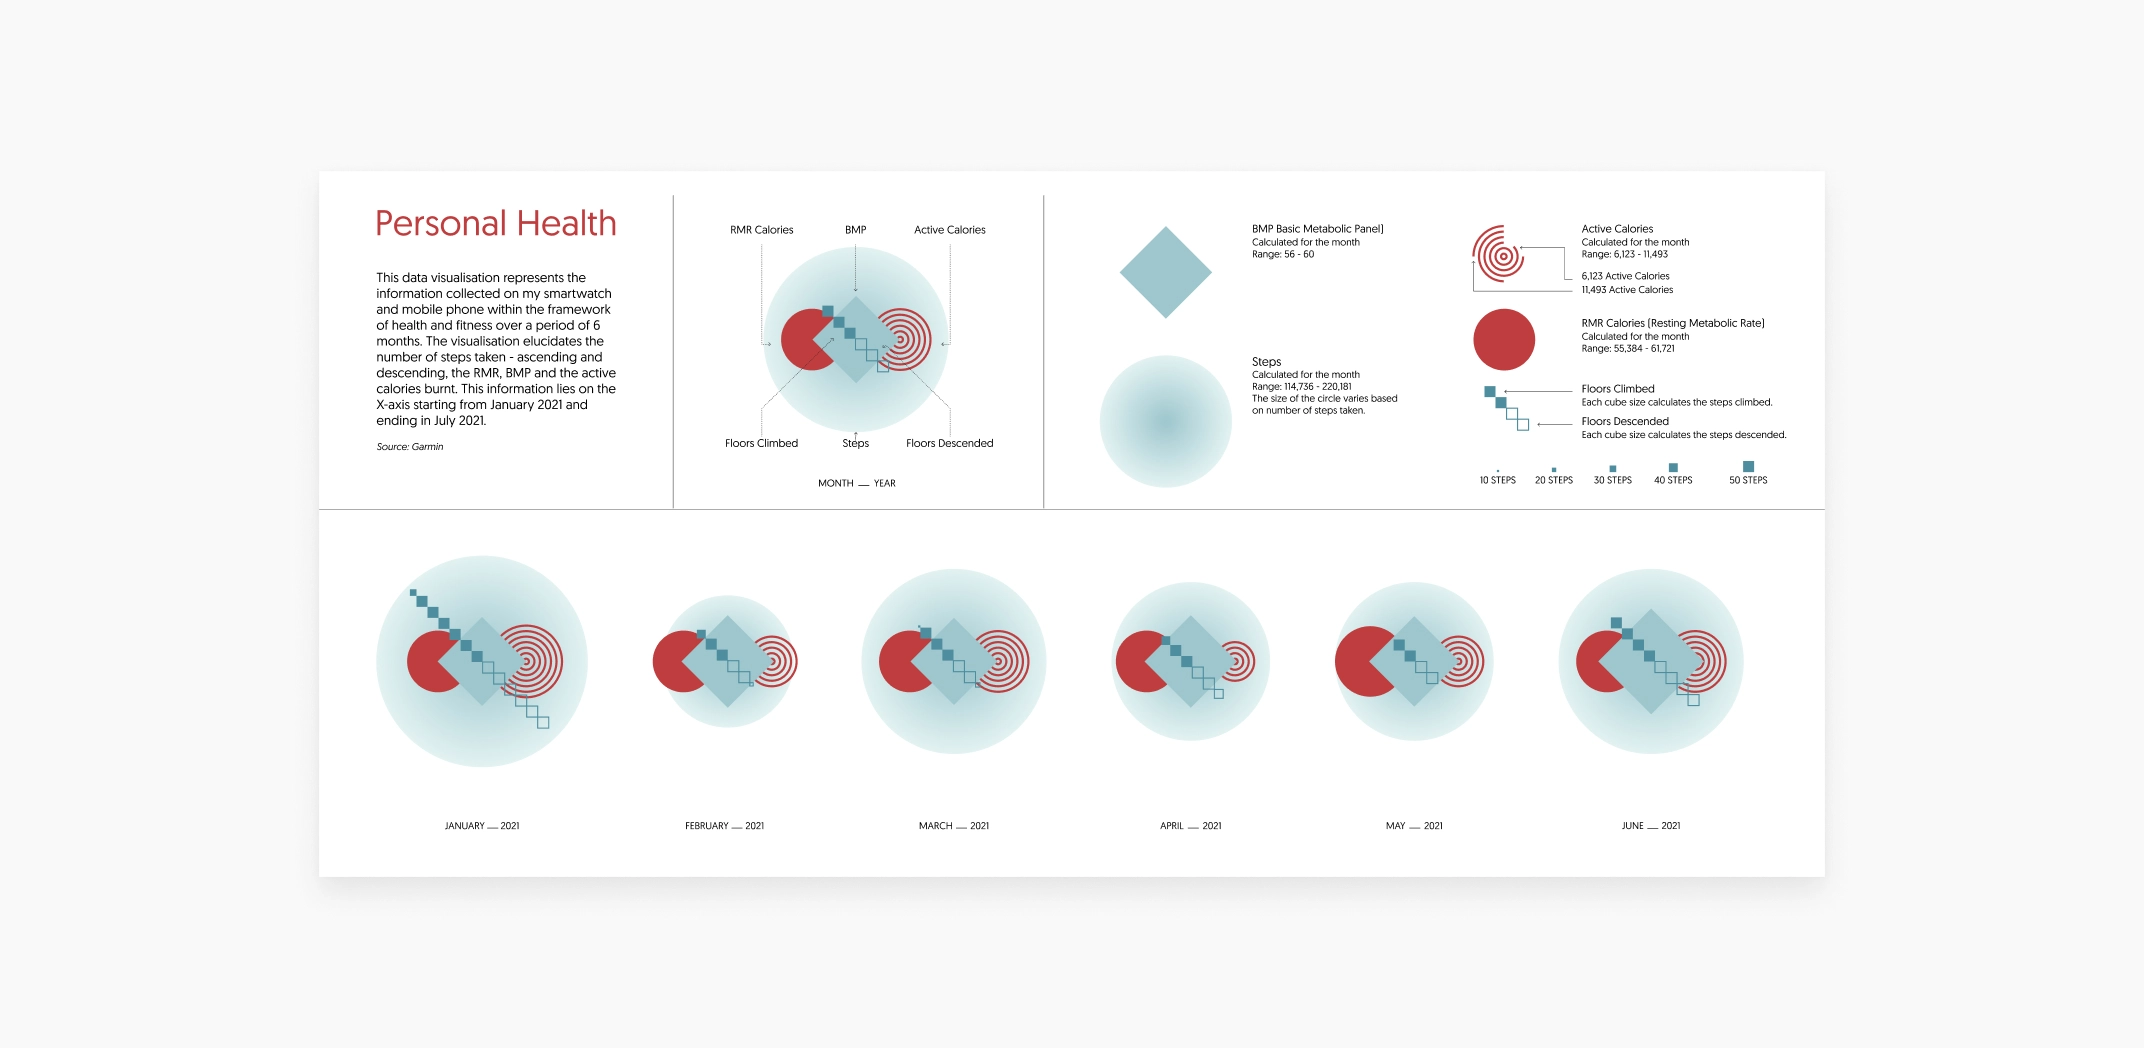
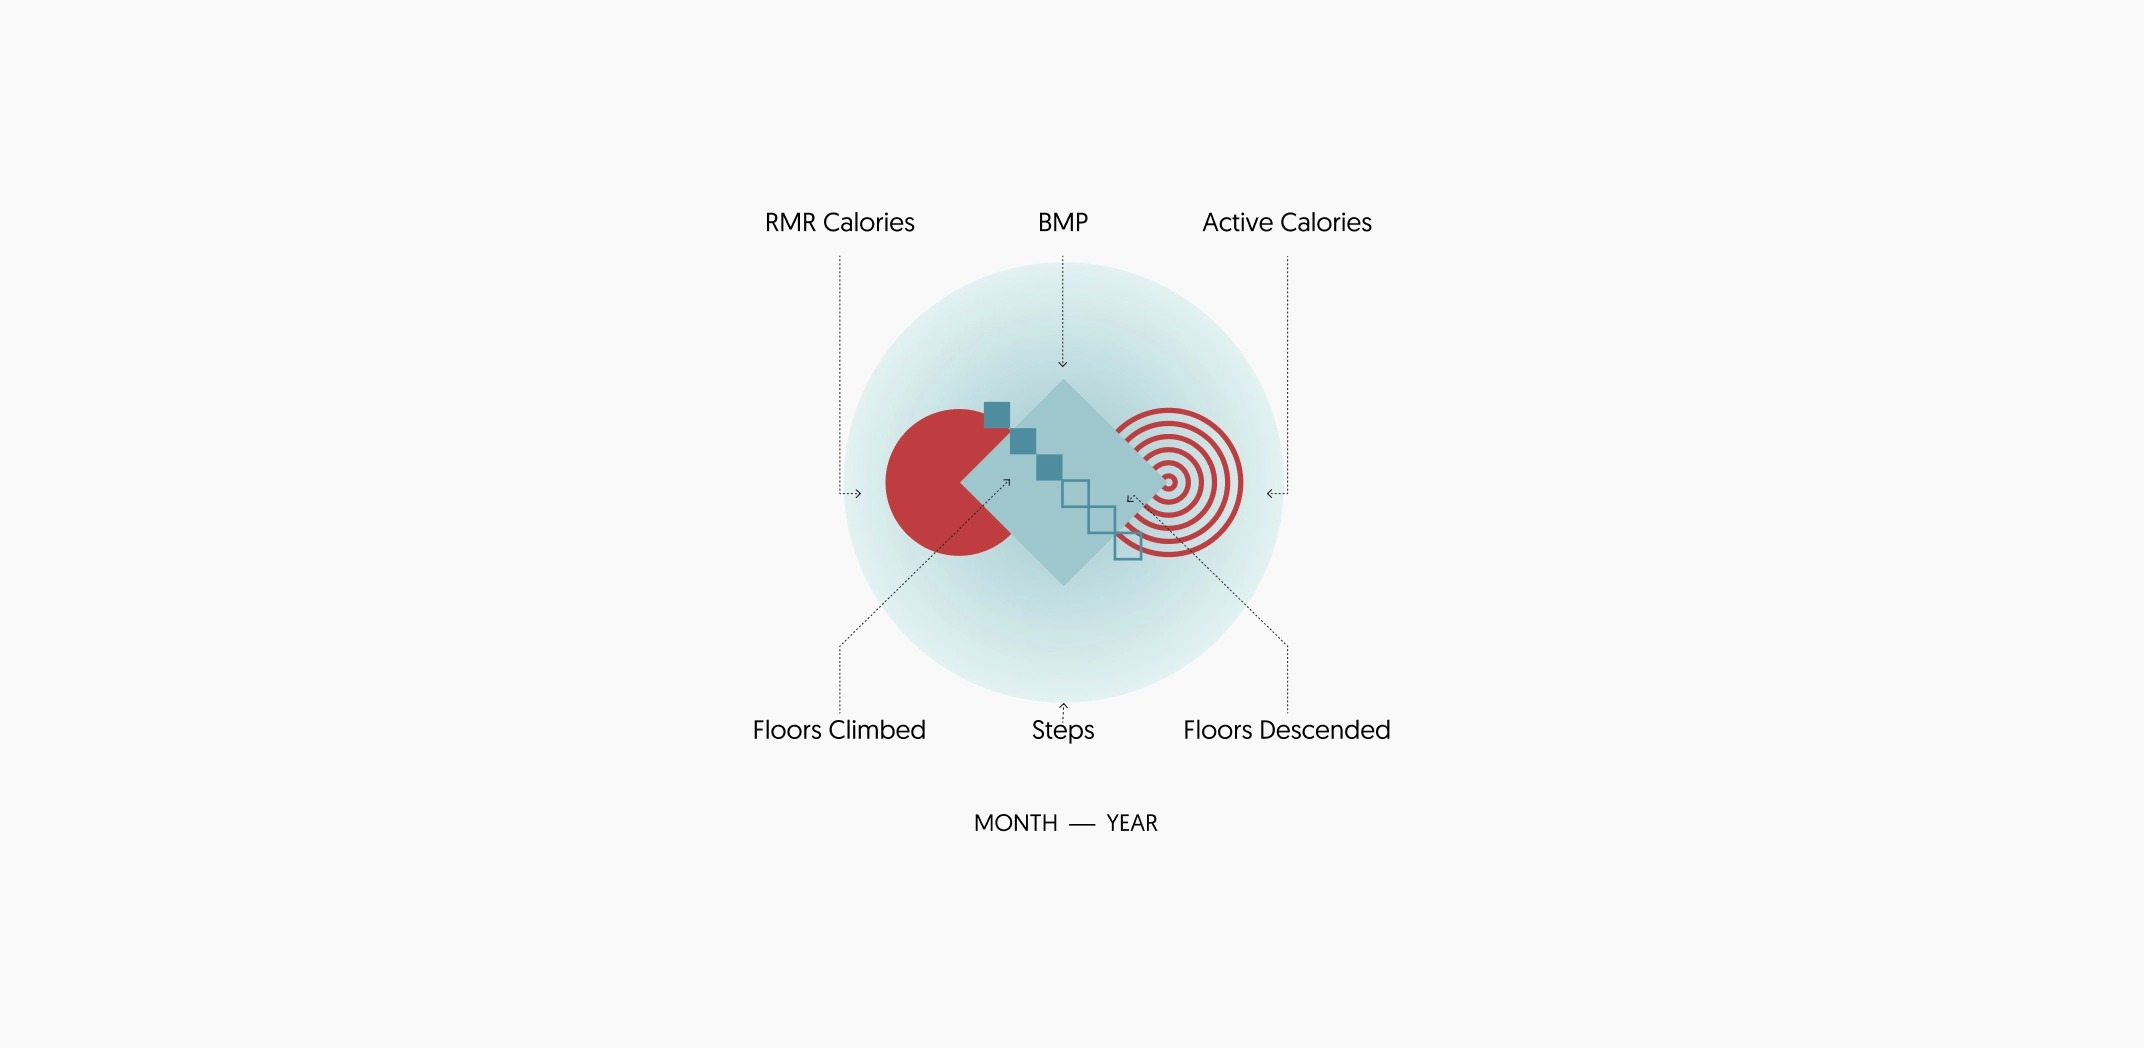
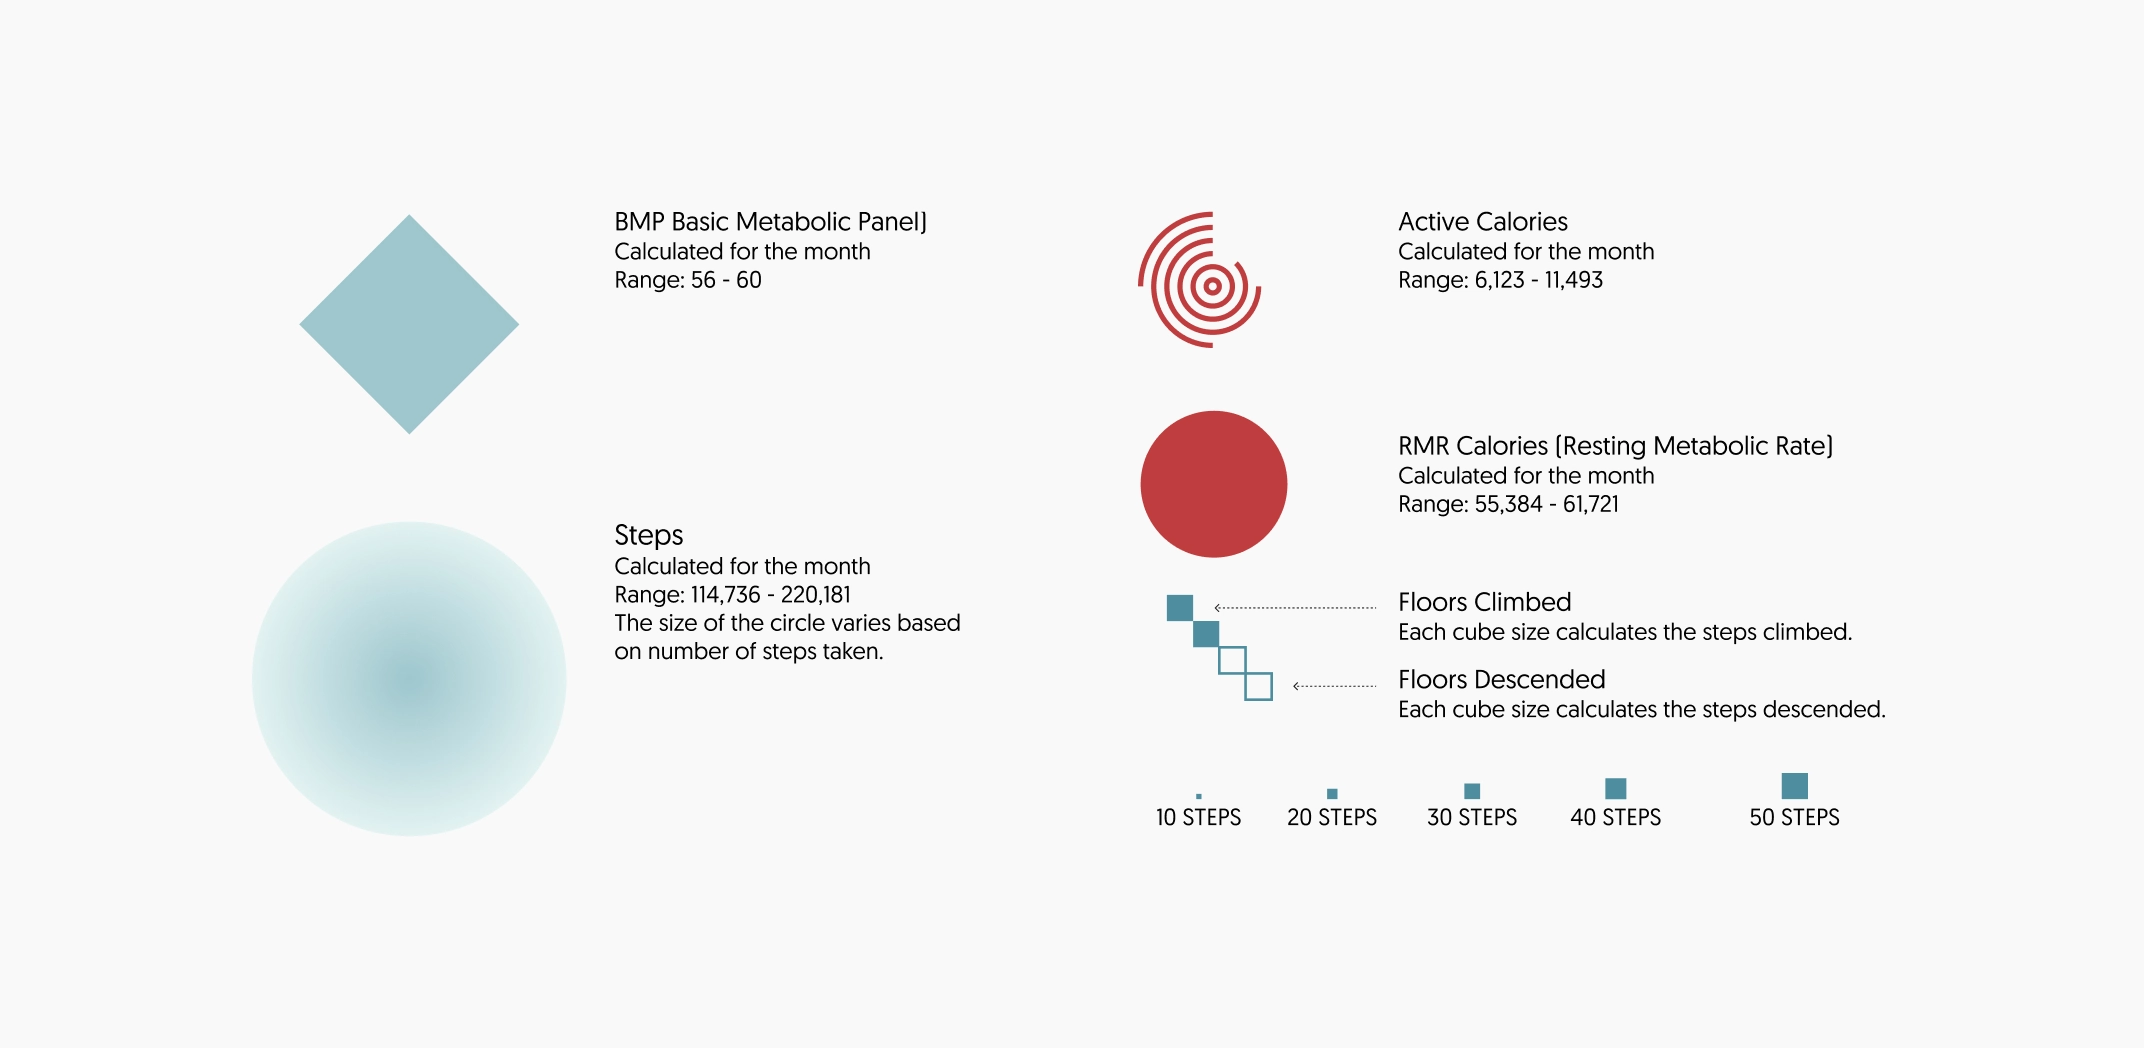
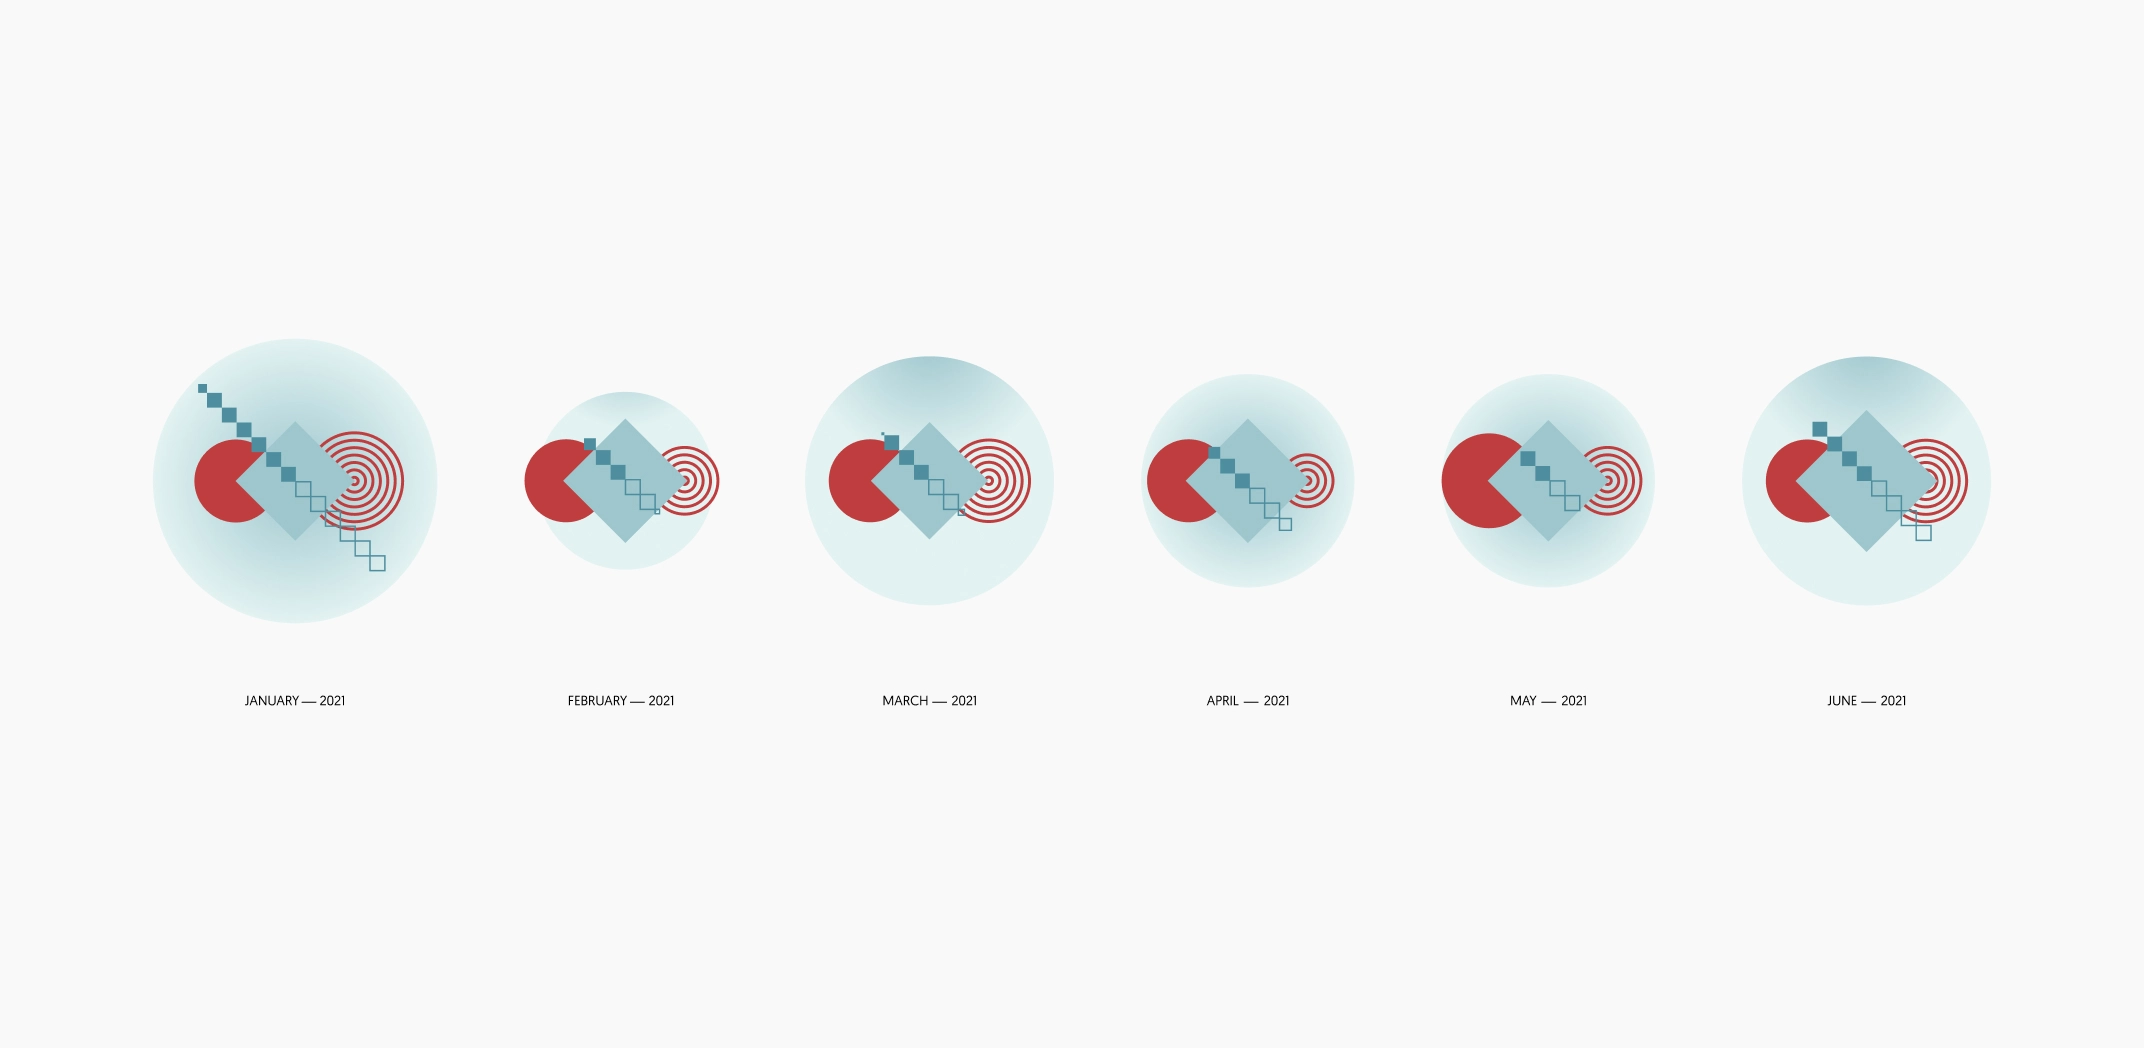
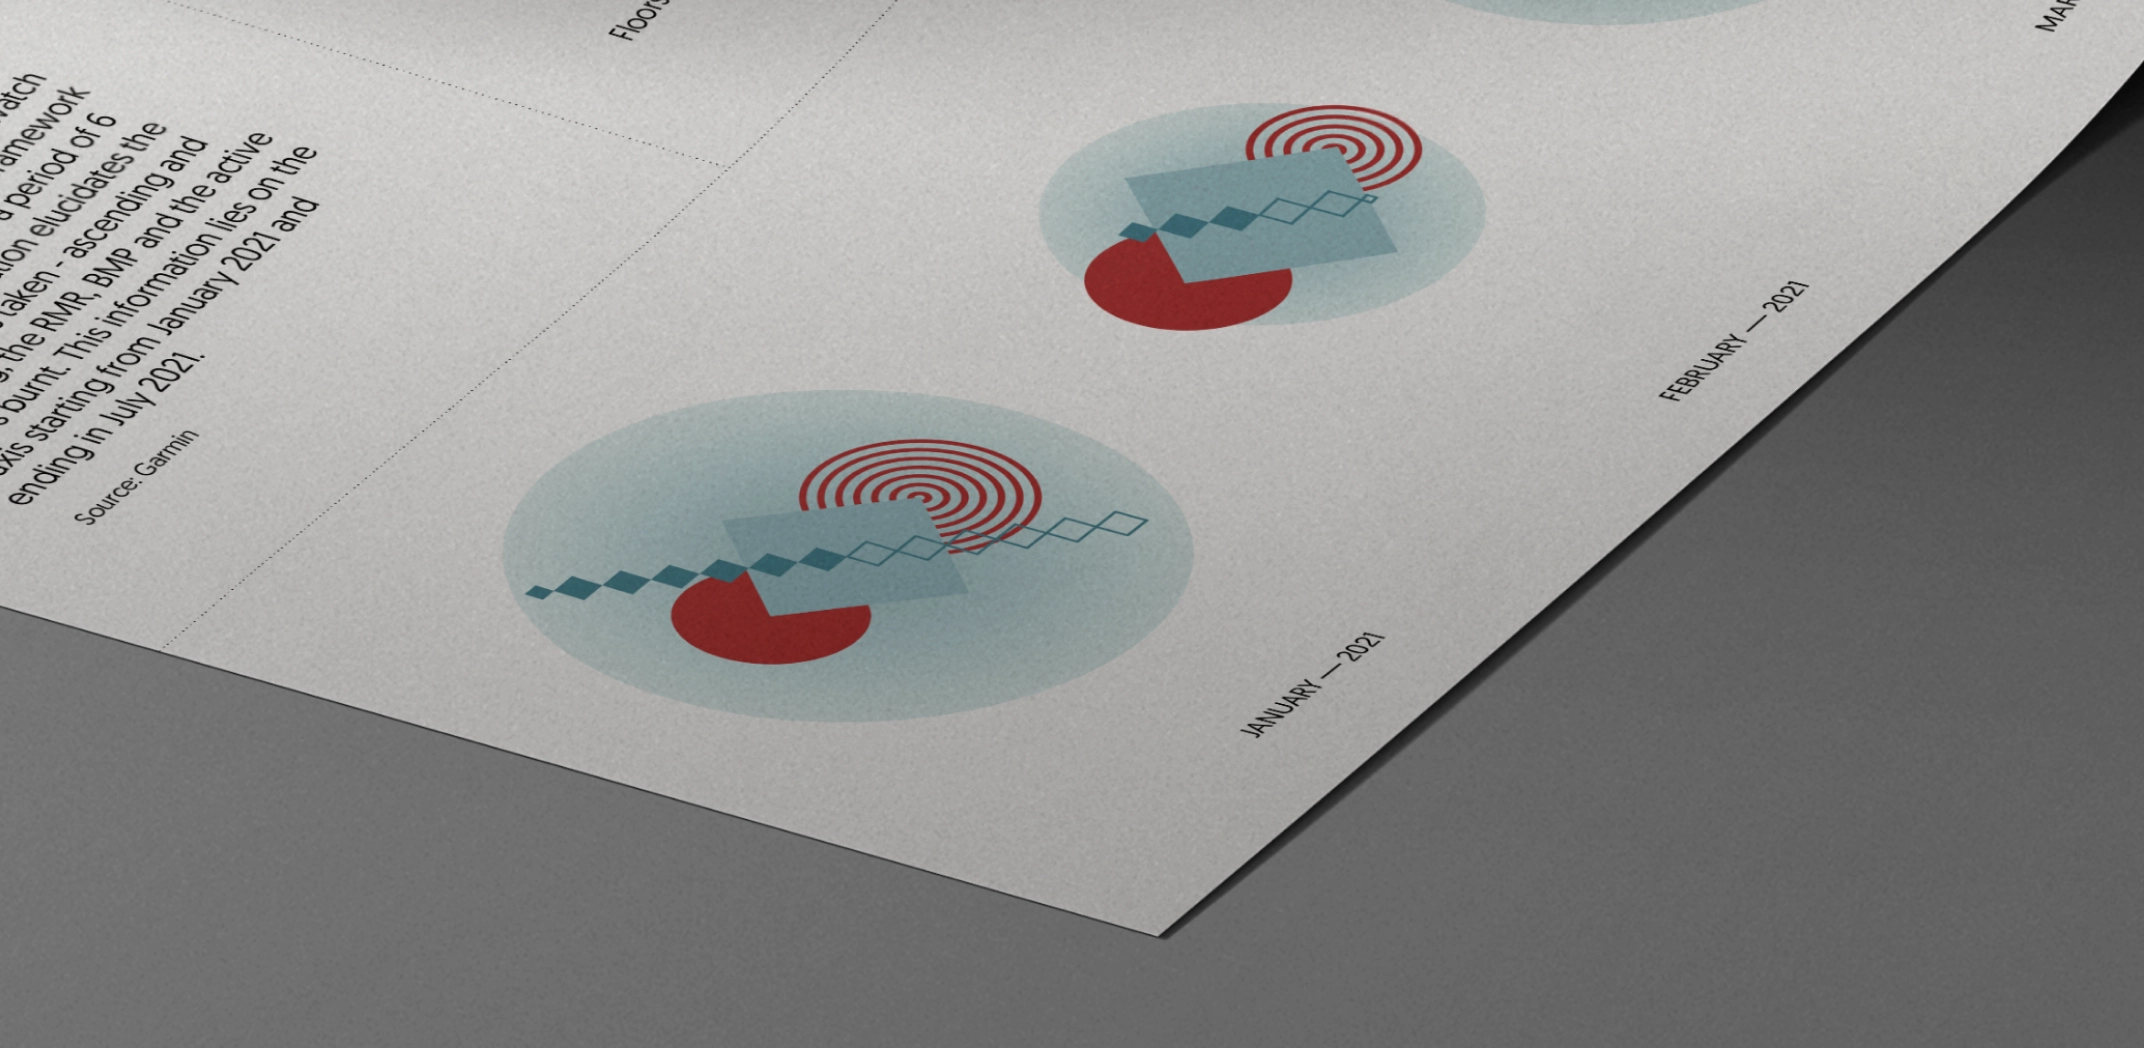
This data visualisation represents the information collected on my smartwatch and mobile phone within the framework of health and fitness over a period of 6 months. The visualisation elucidates the number of steps taken, ascending and descending, the RMR, BMP and the active calories burnt. This information lies on the X-axis starting from January 2021 and ending in July 2021.
Fun World
Growing up in the 1990s, amusement parks served as spaces for leisure and play. In India, during the summer these make-shift amusement parks moved from one place to another, dismantled and reassembled in every new location, and were often called ‘fun world’. This series of loop animations focuses on representing different structures and the rhythmic movements associated with them.

Ghar
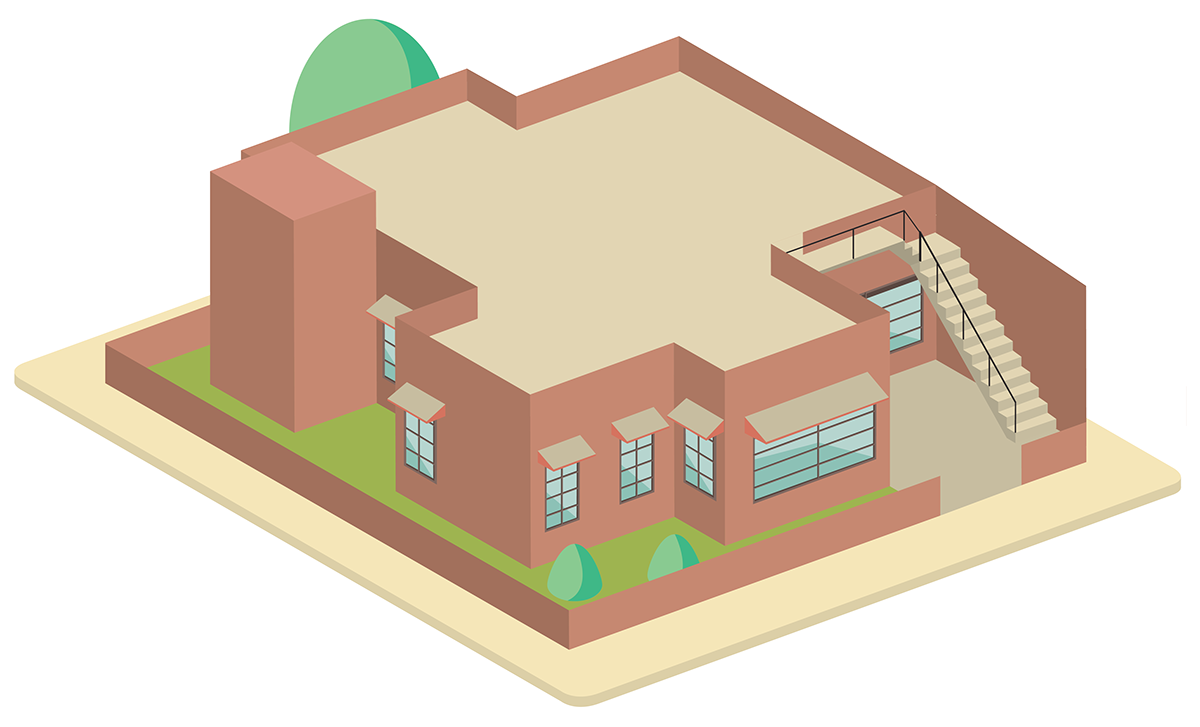
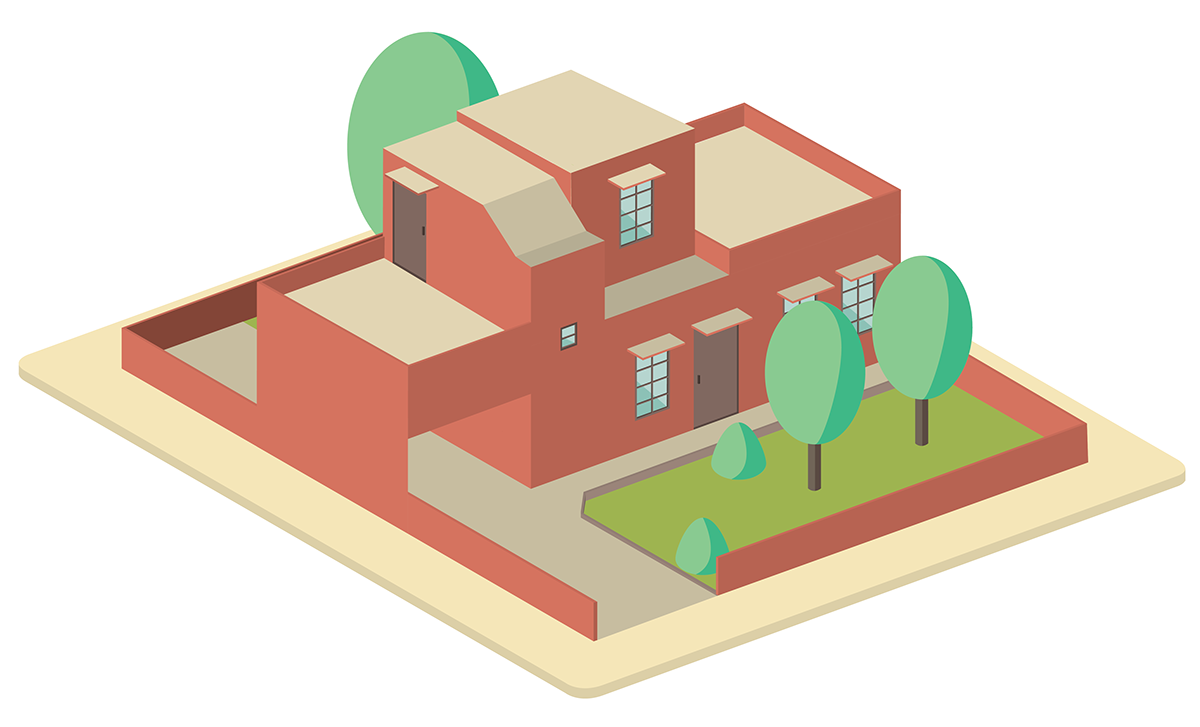
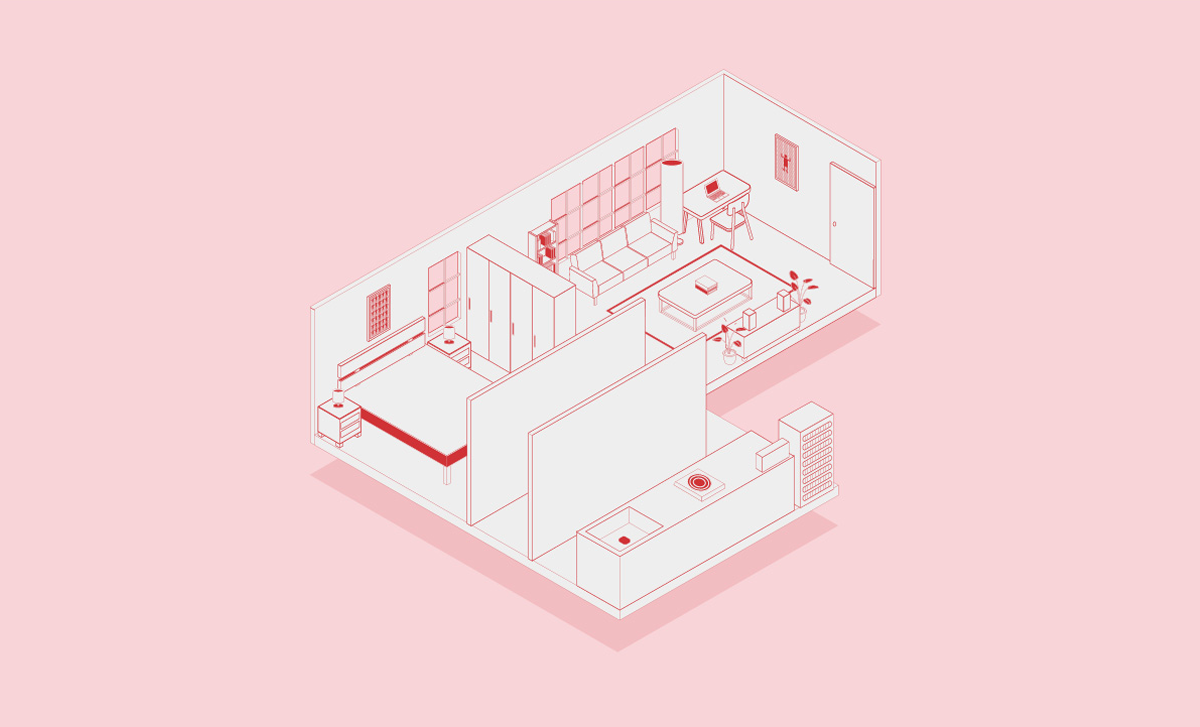
‘Ghar’, literally translated to home, is an ongoing series of drawings from memory that represent the houses I have lived in since 2010. Growing up I was surrounded by architectural drawings that my father made, and this series stems from my interest in recording the spaces I have lived in as markers of the personal connections I have formed within them.
History of Mac
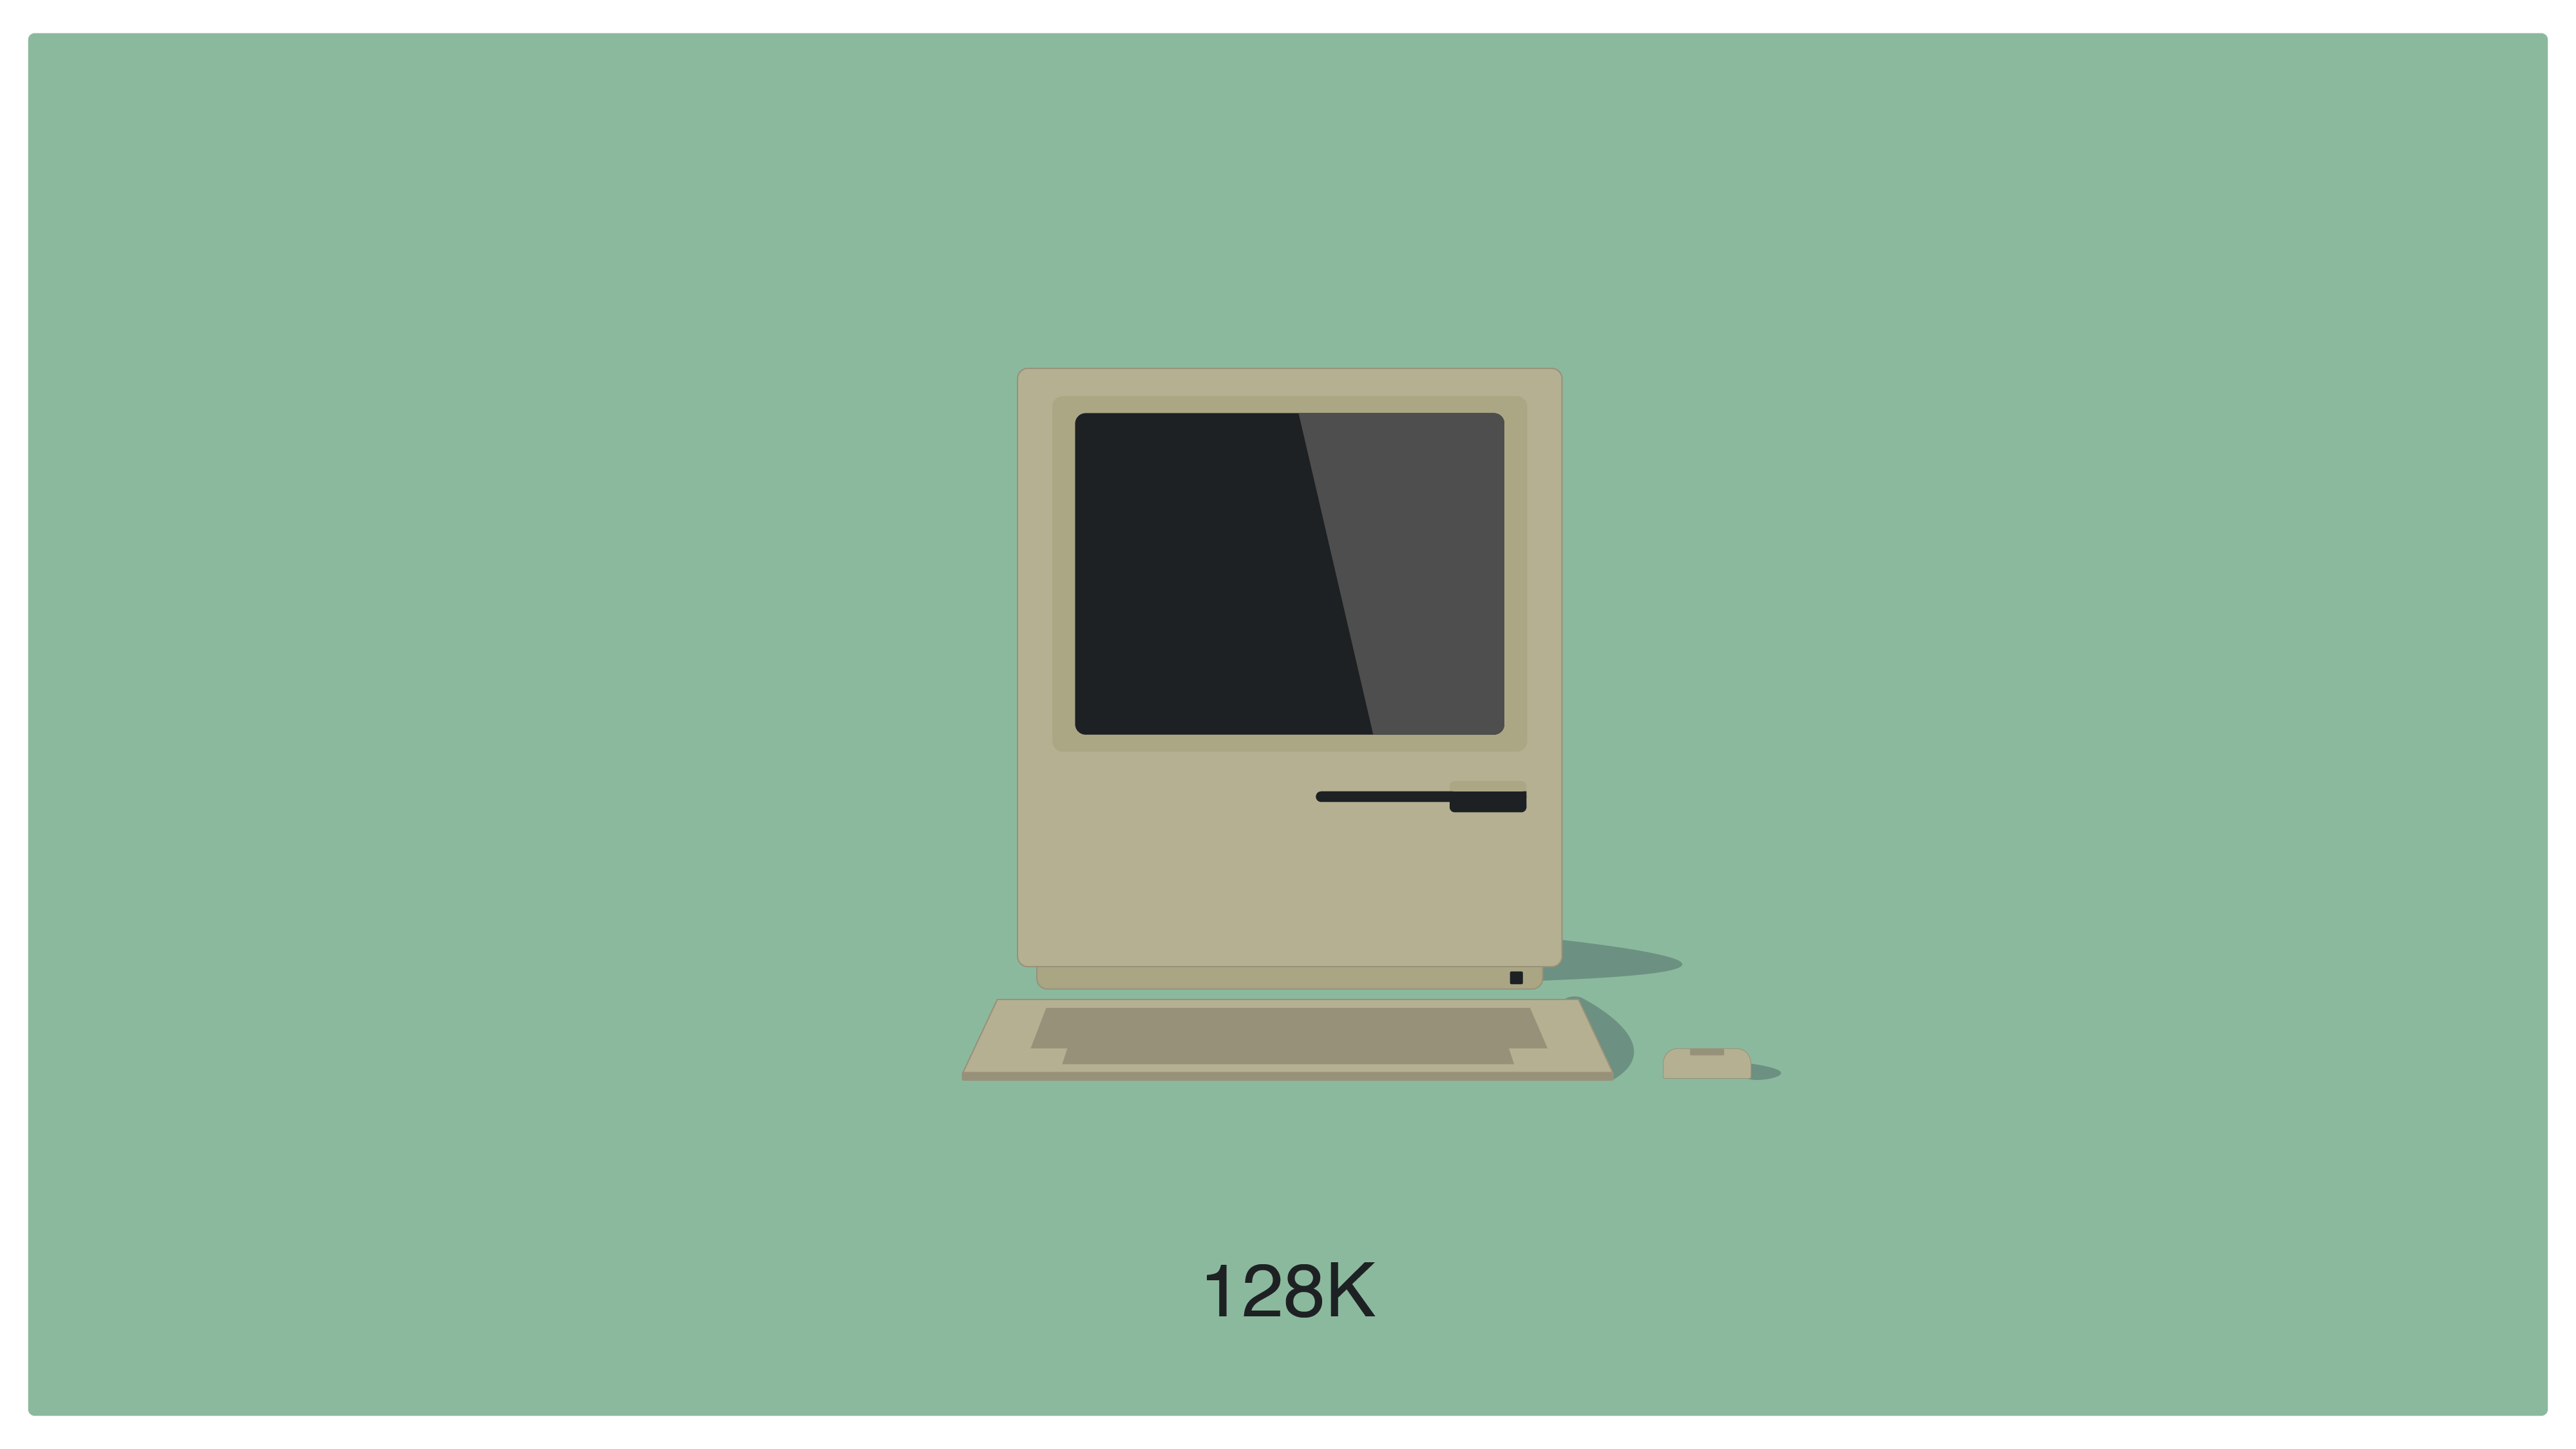
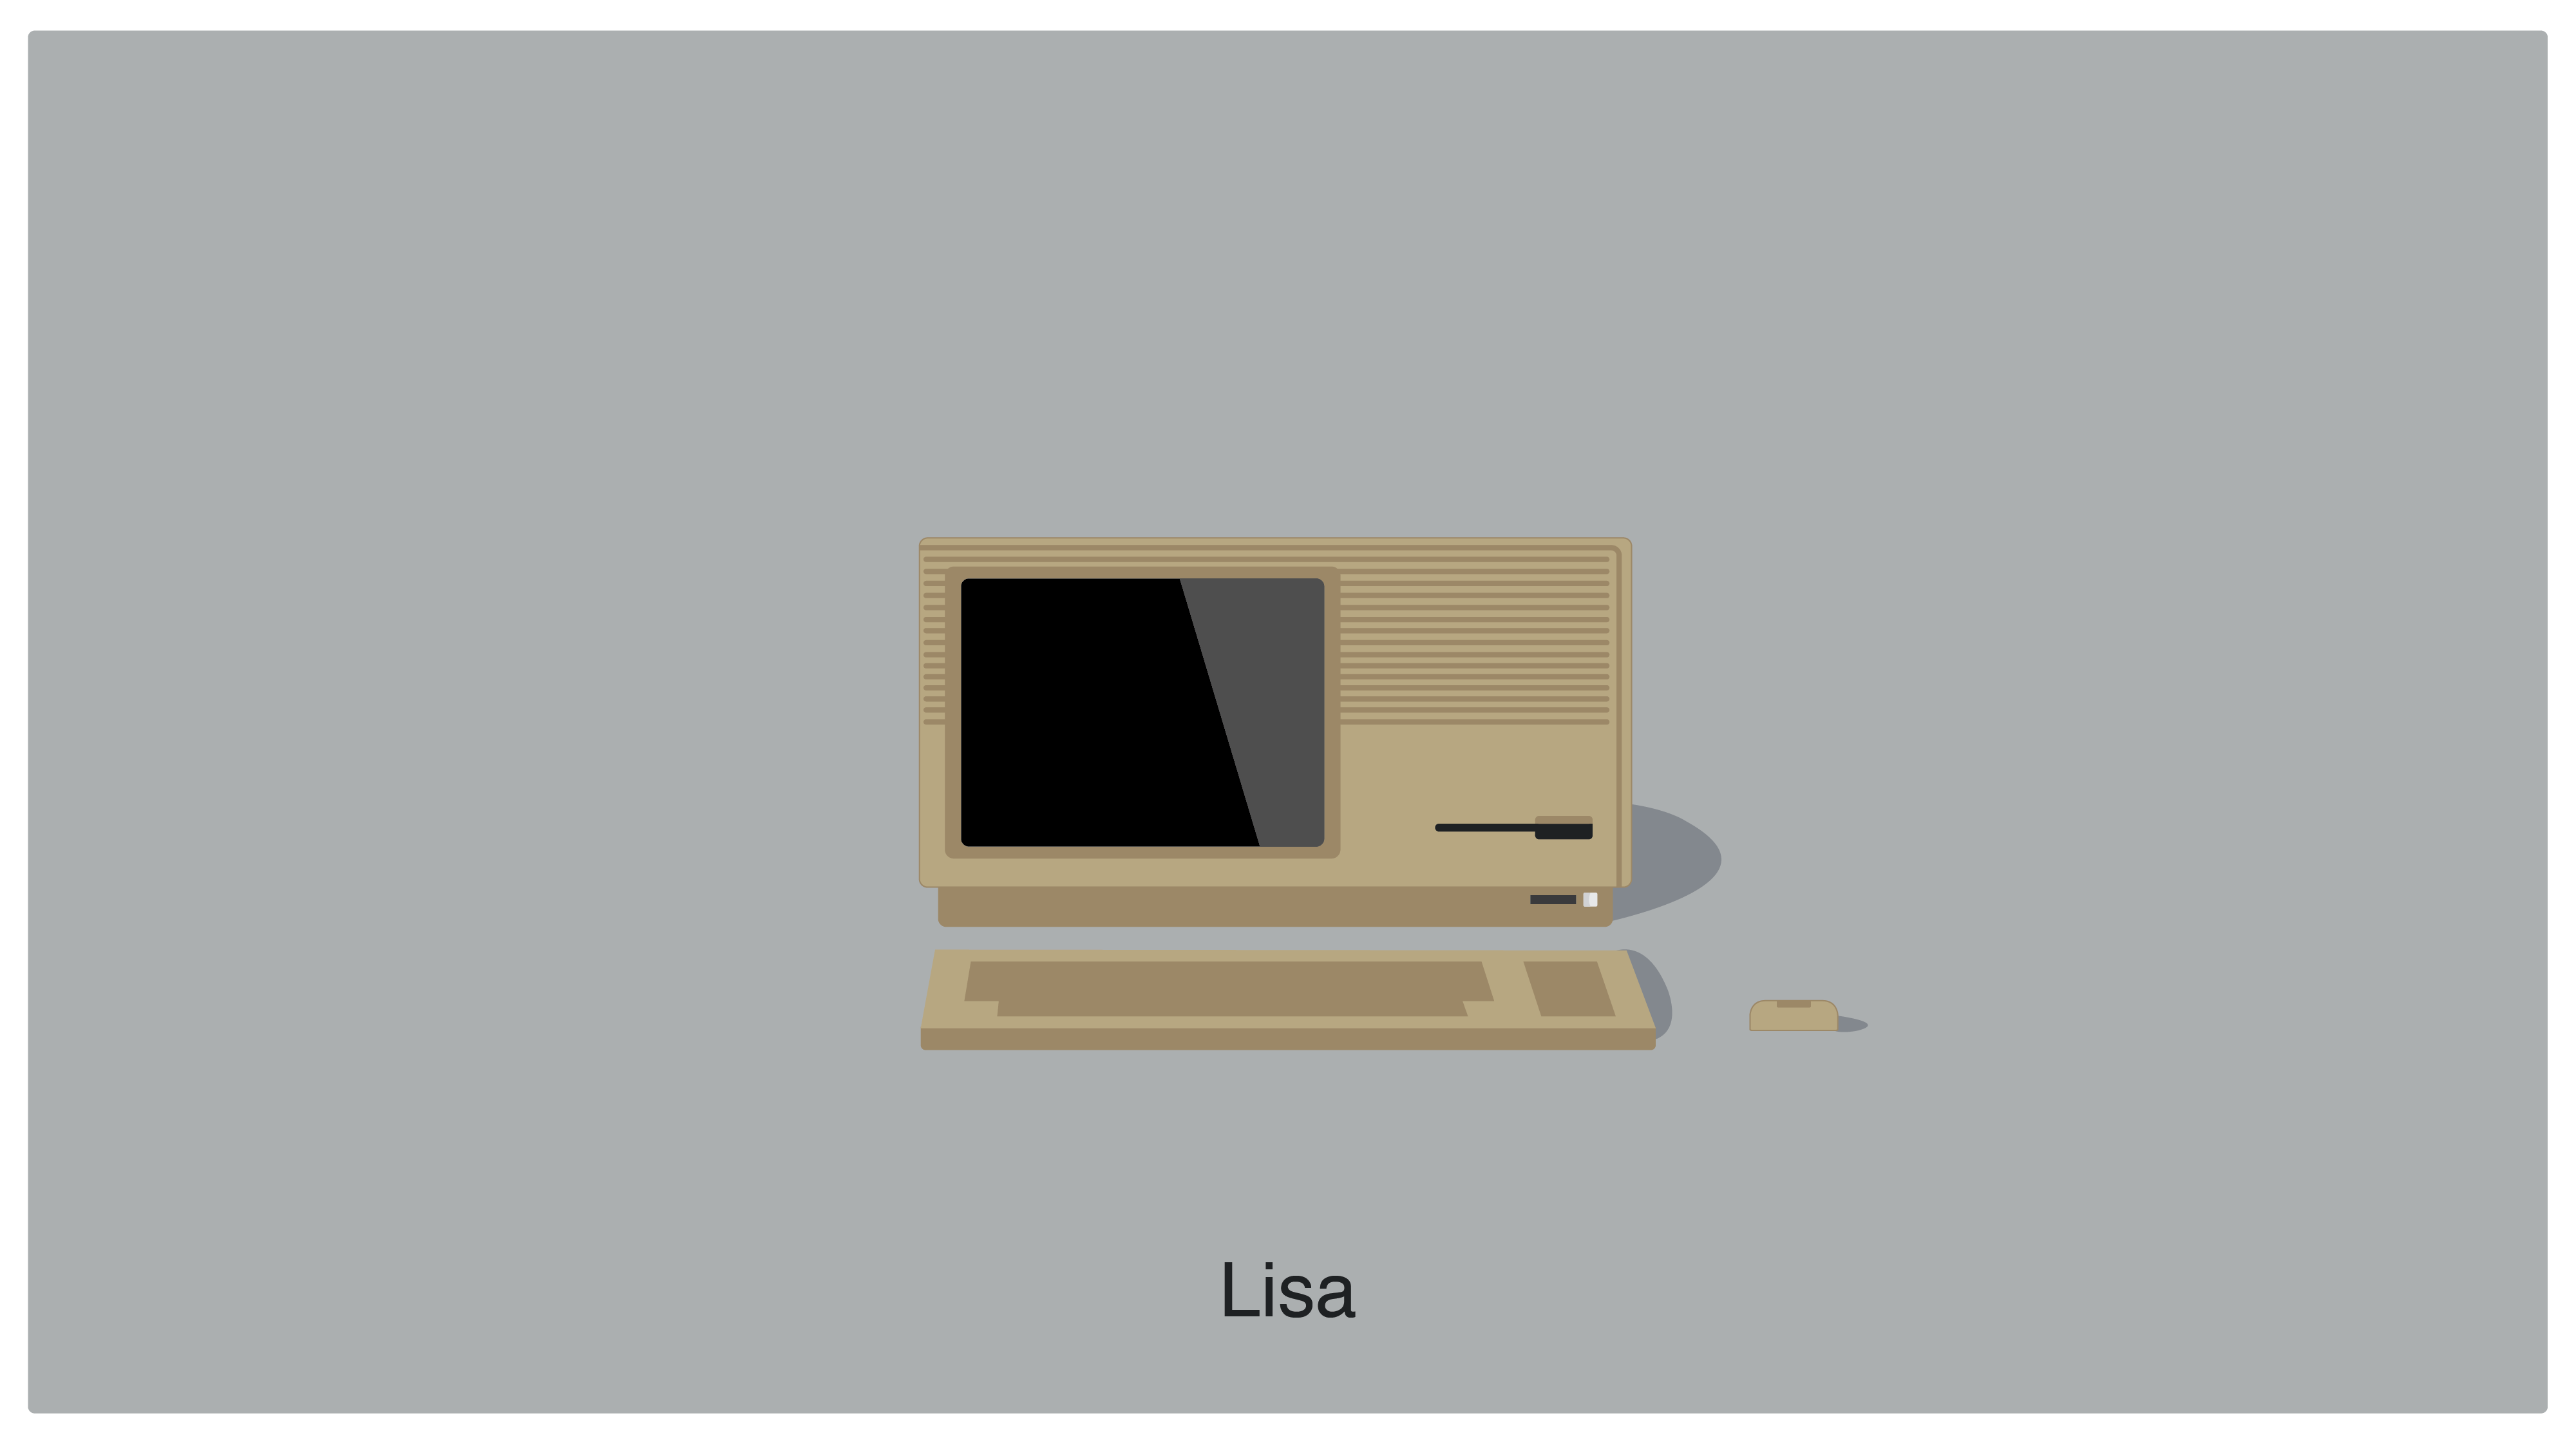
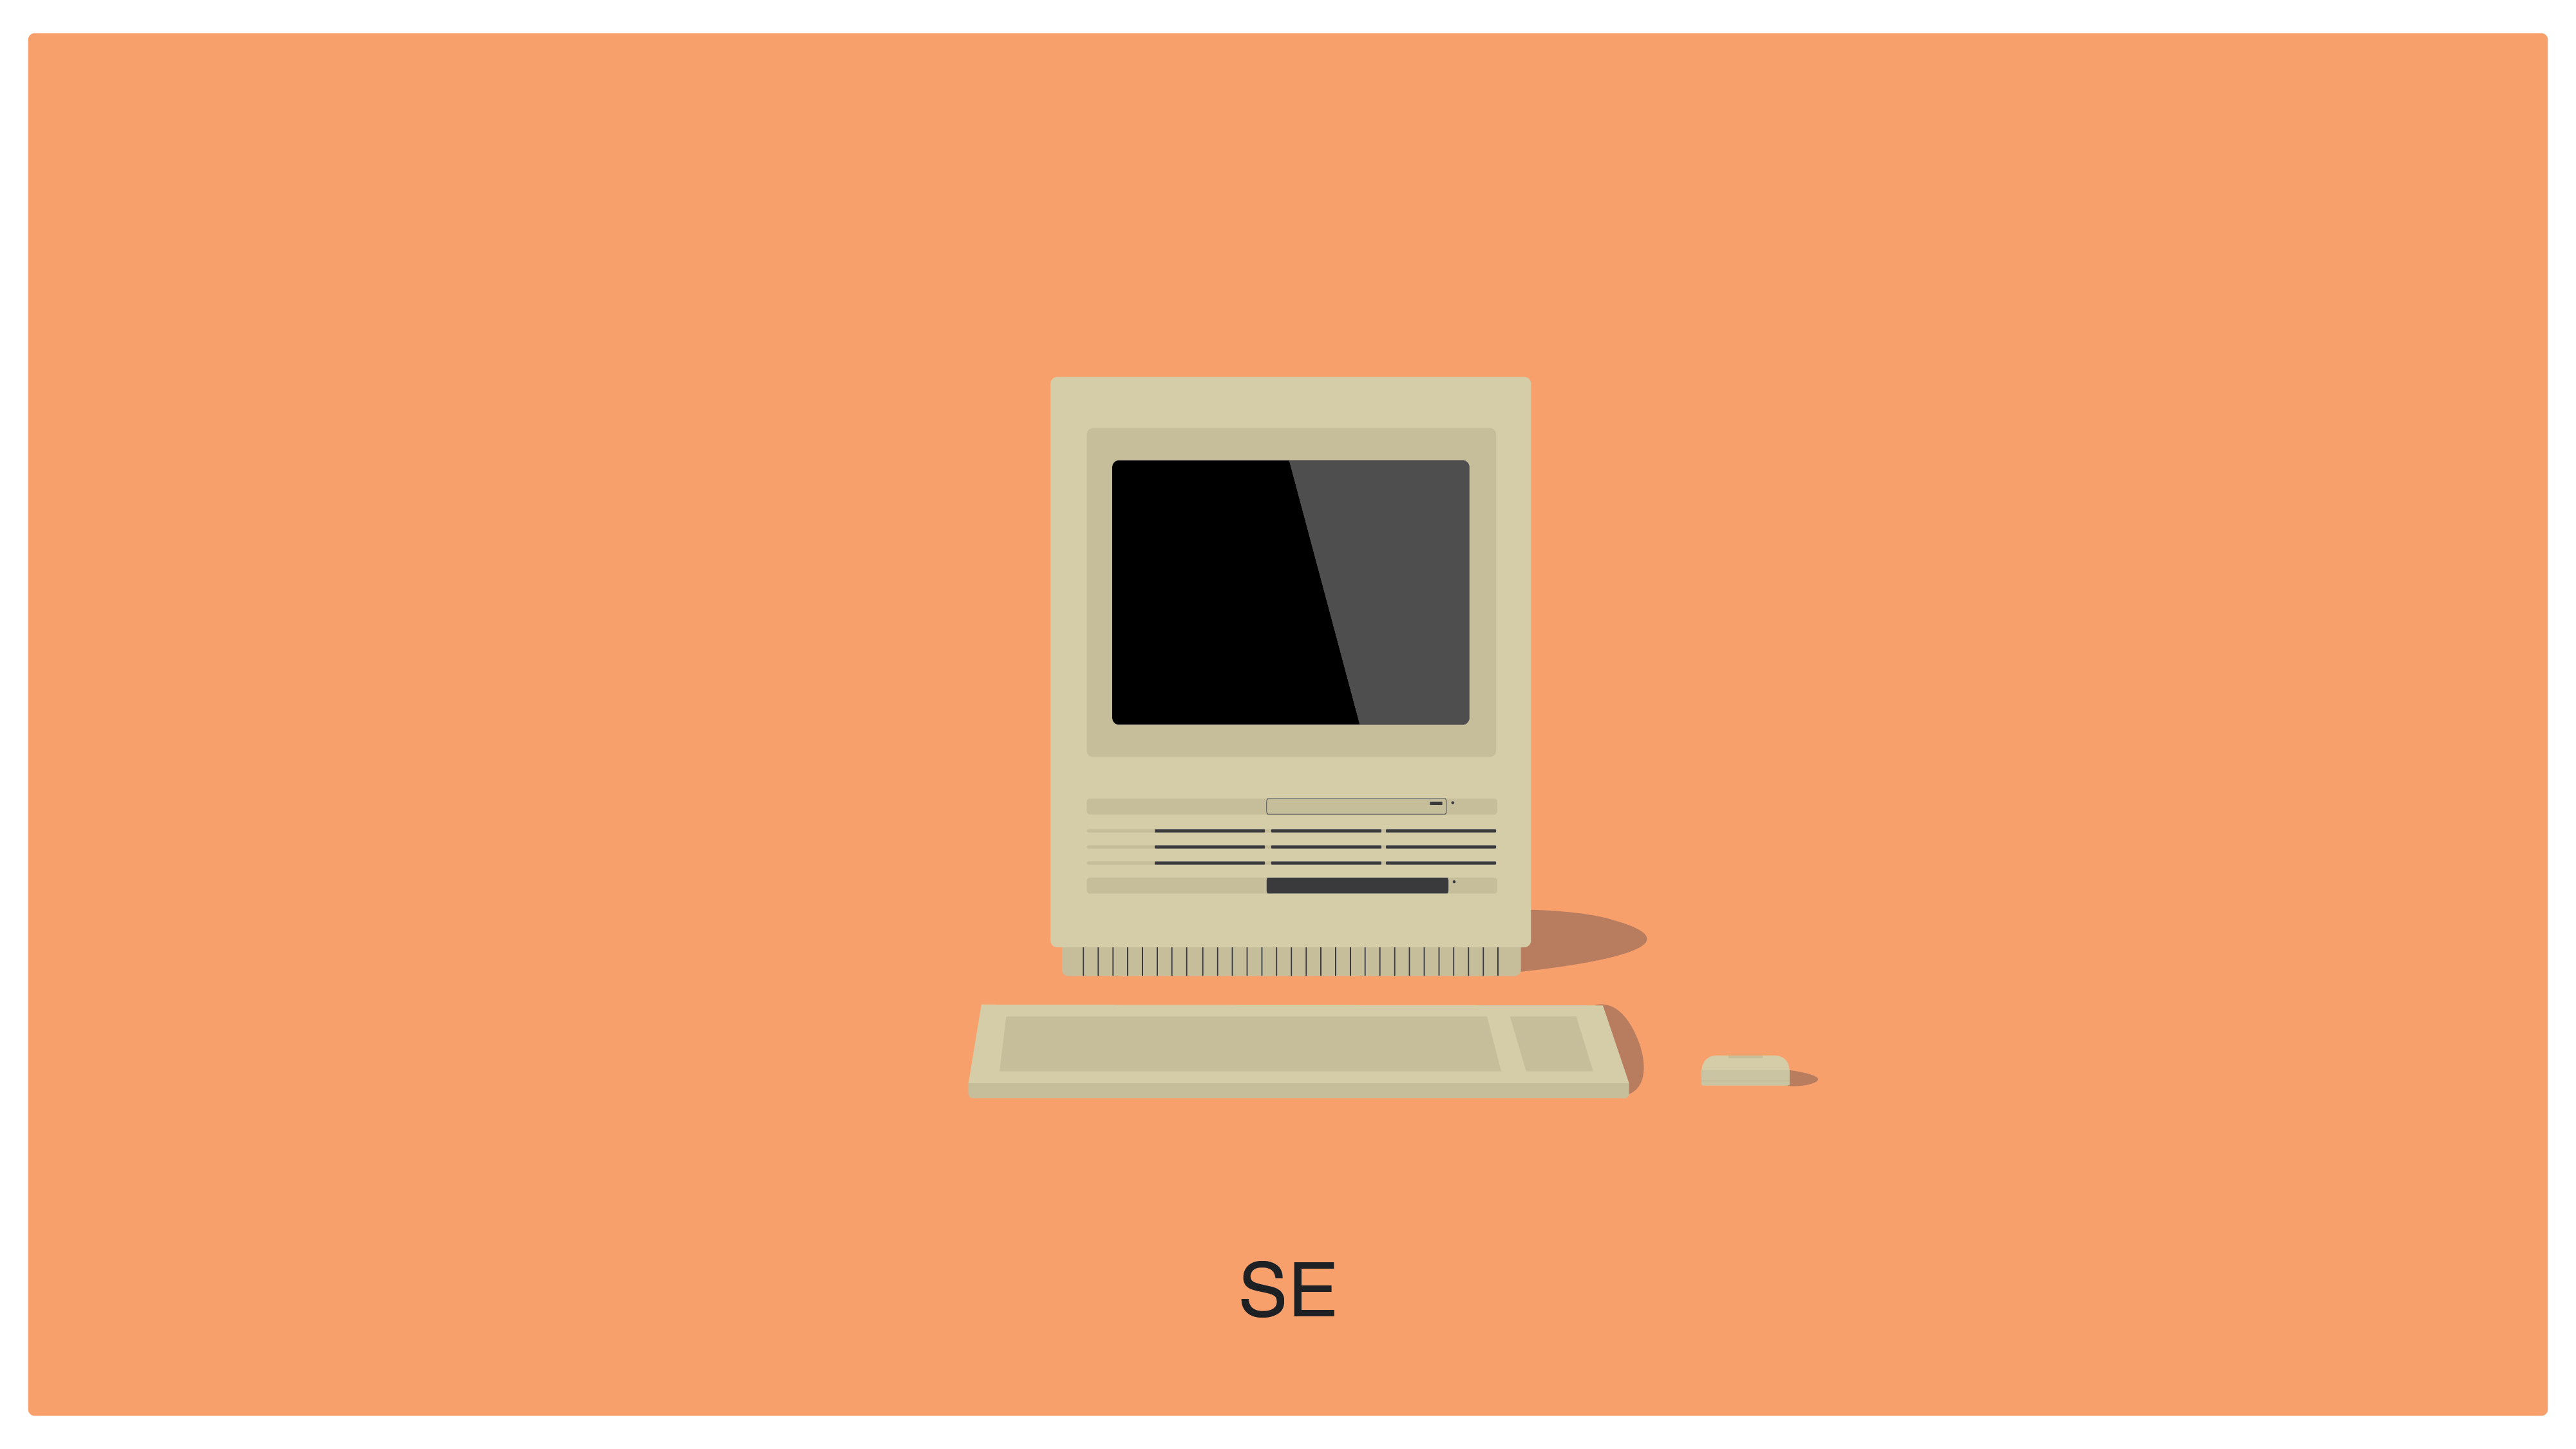
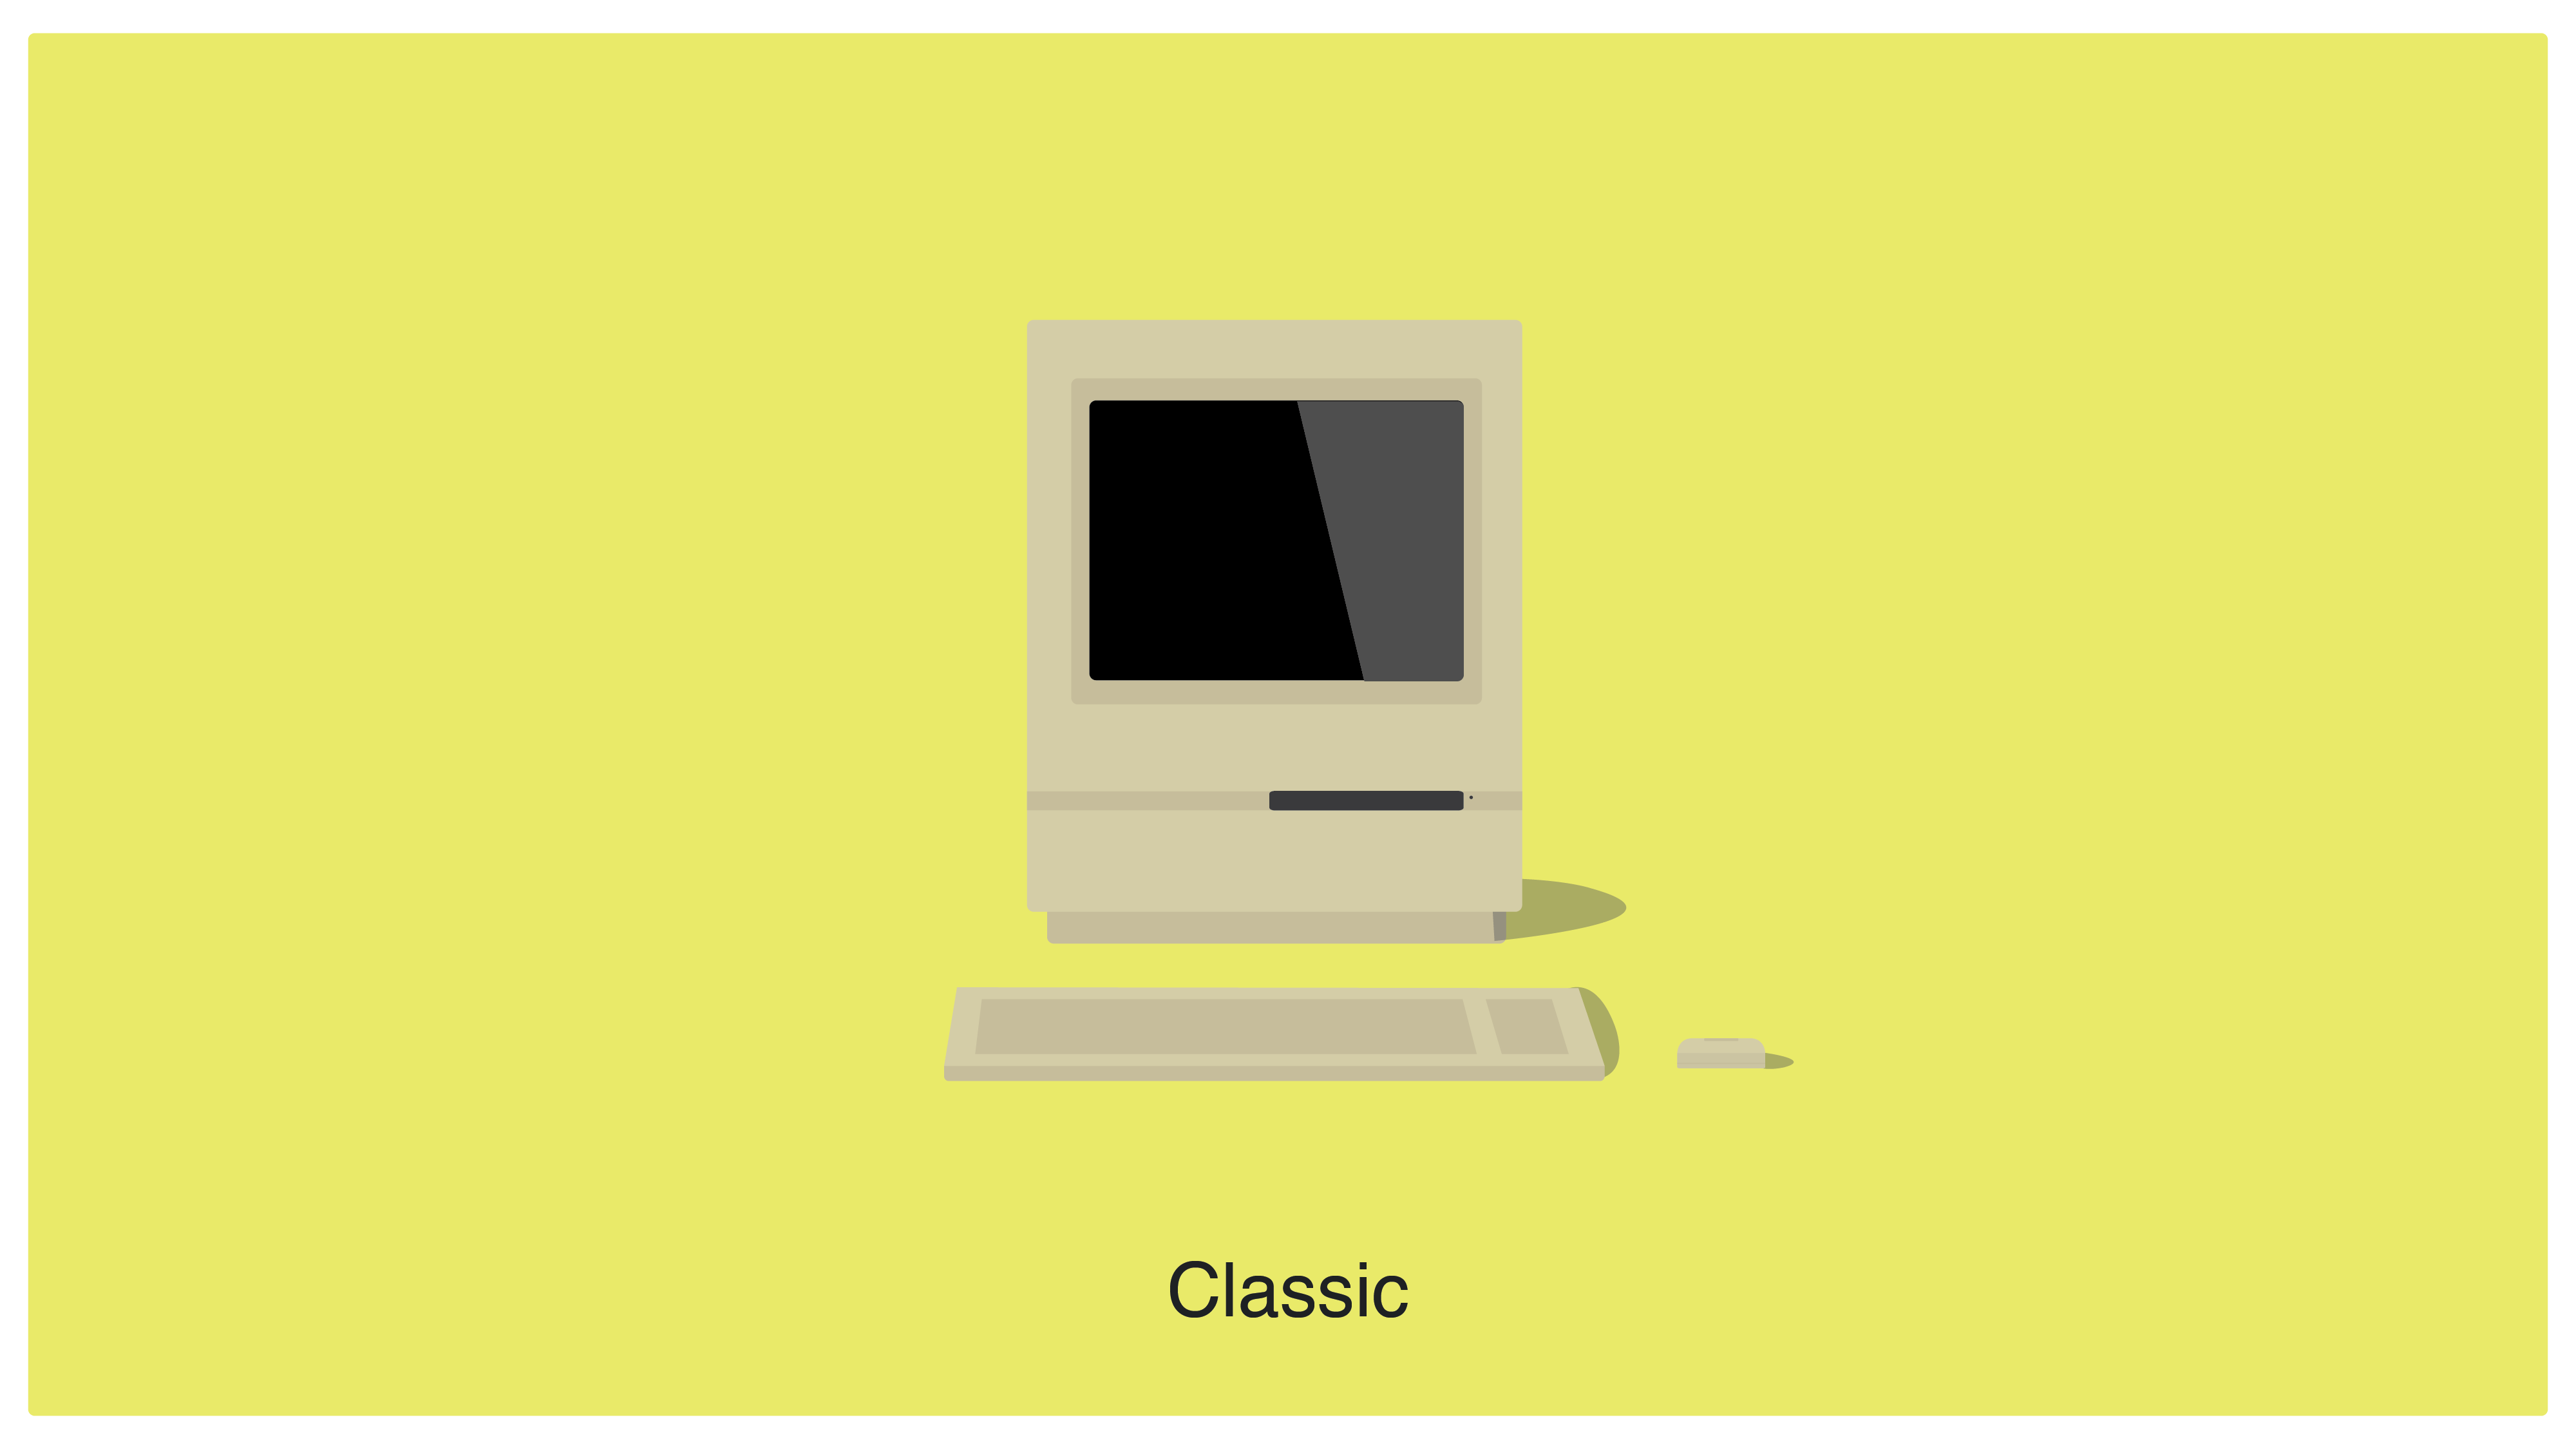
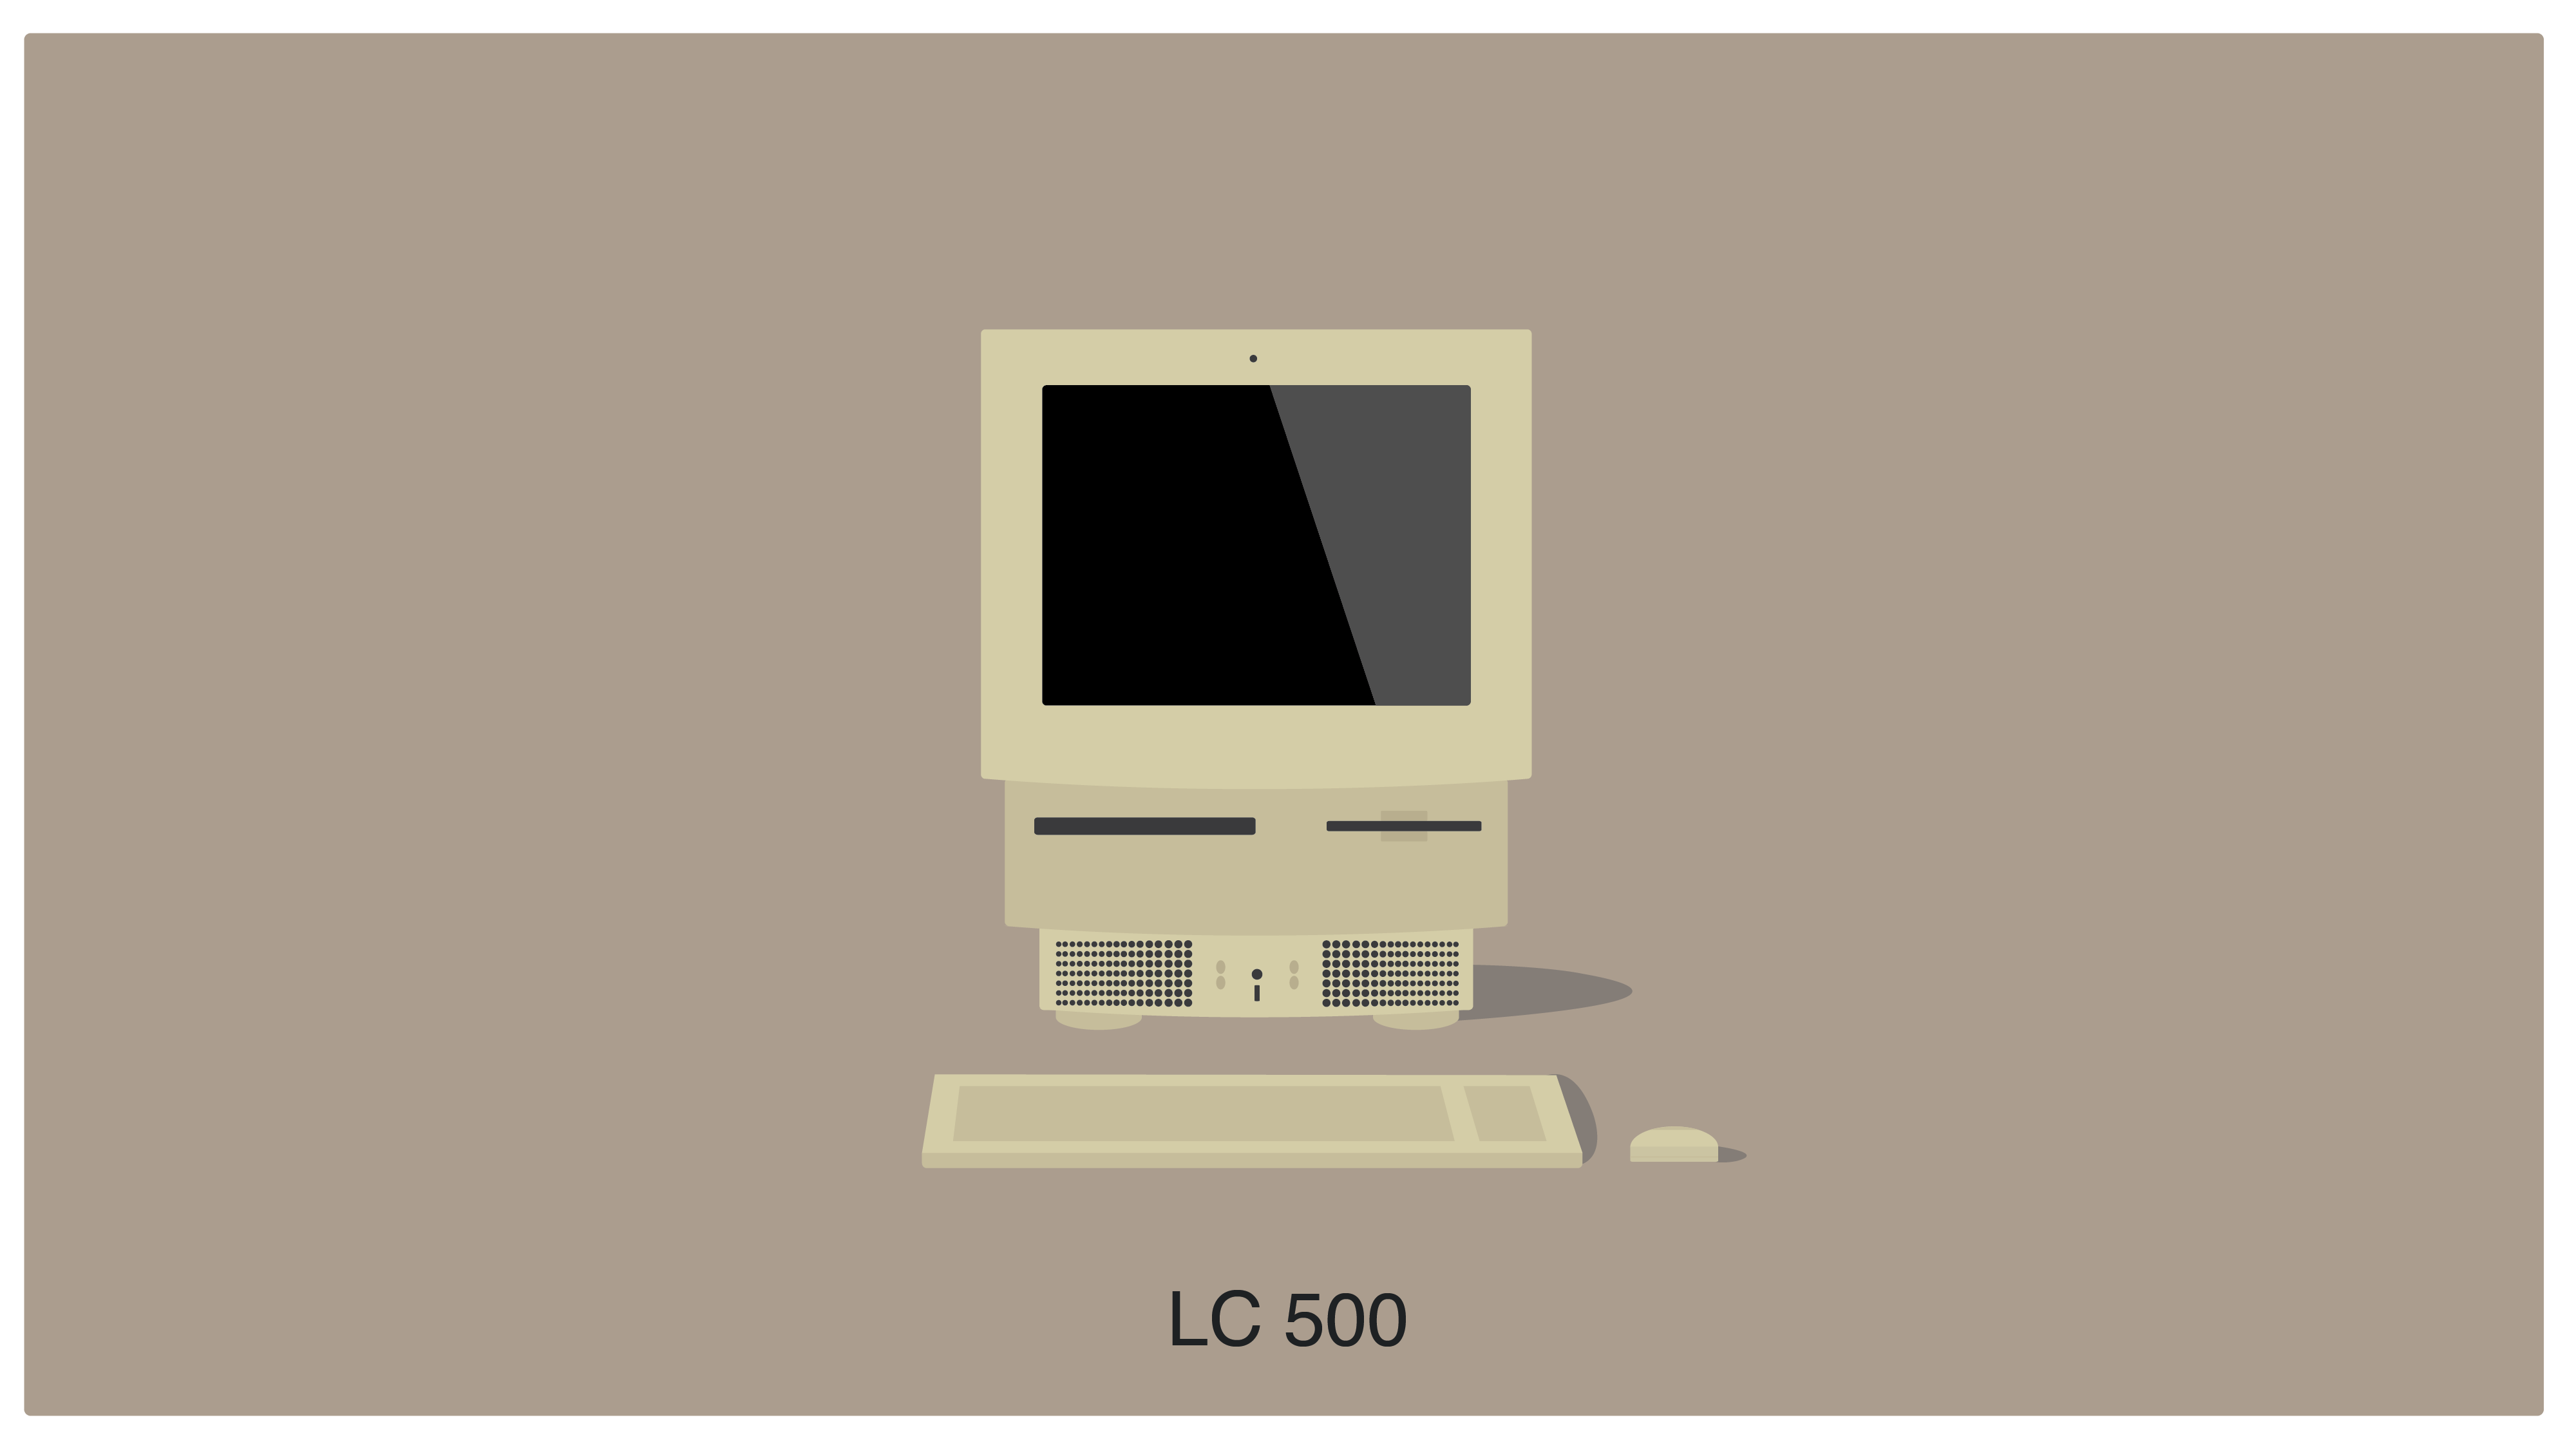
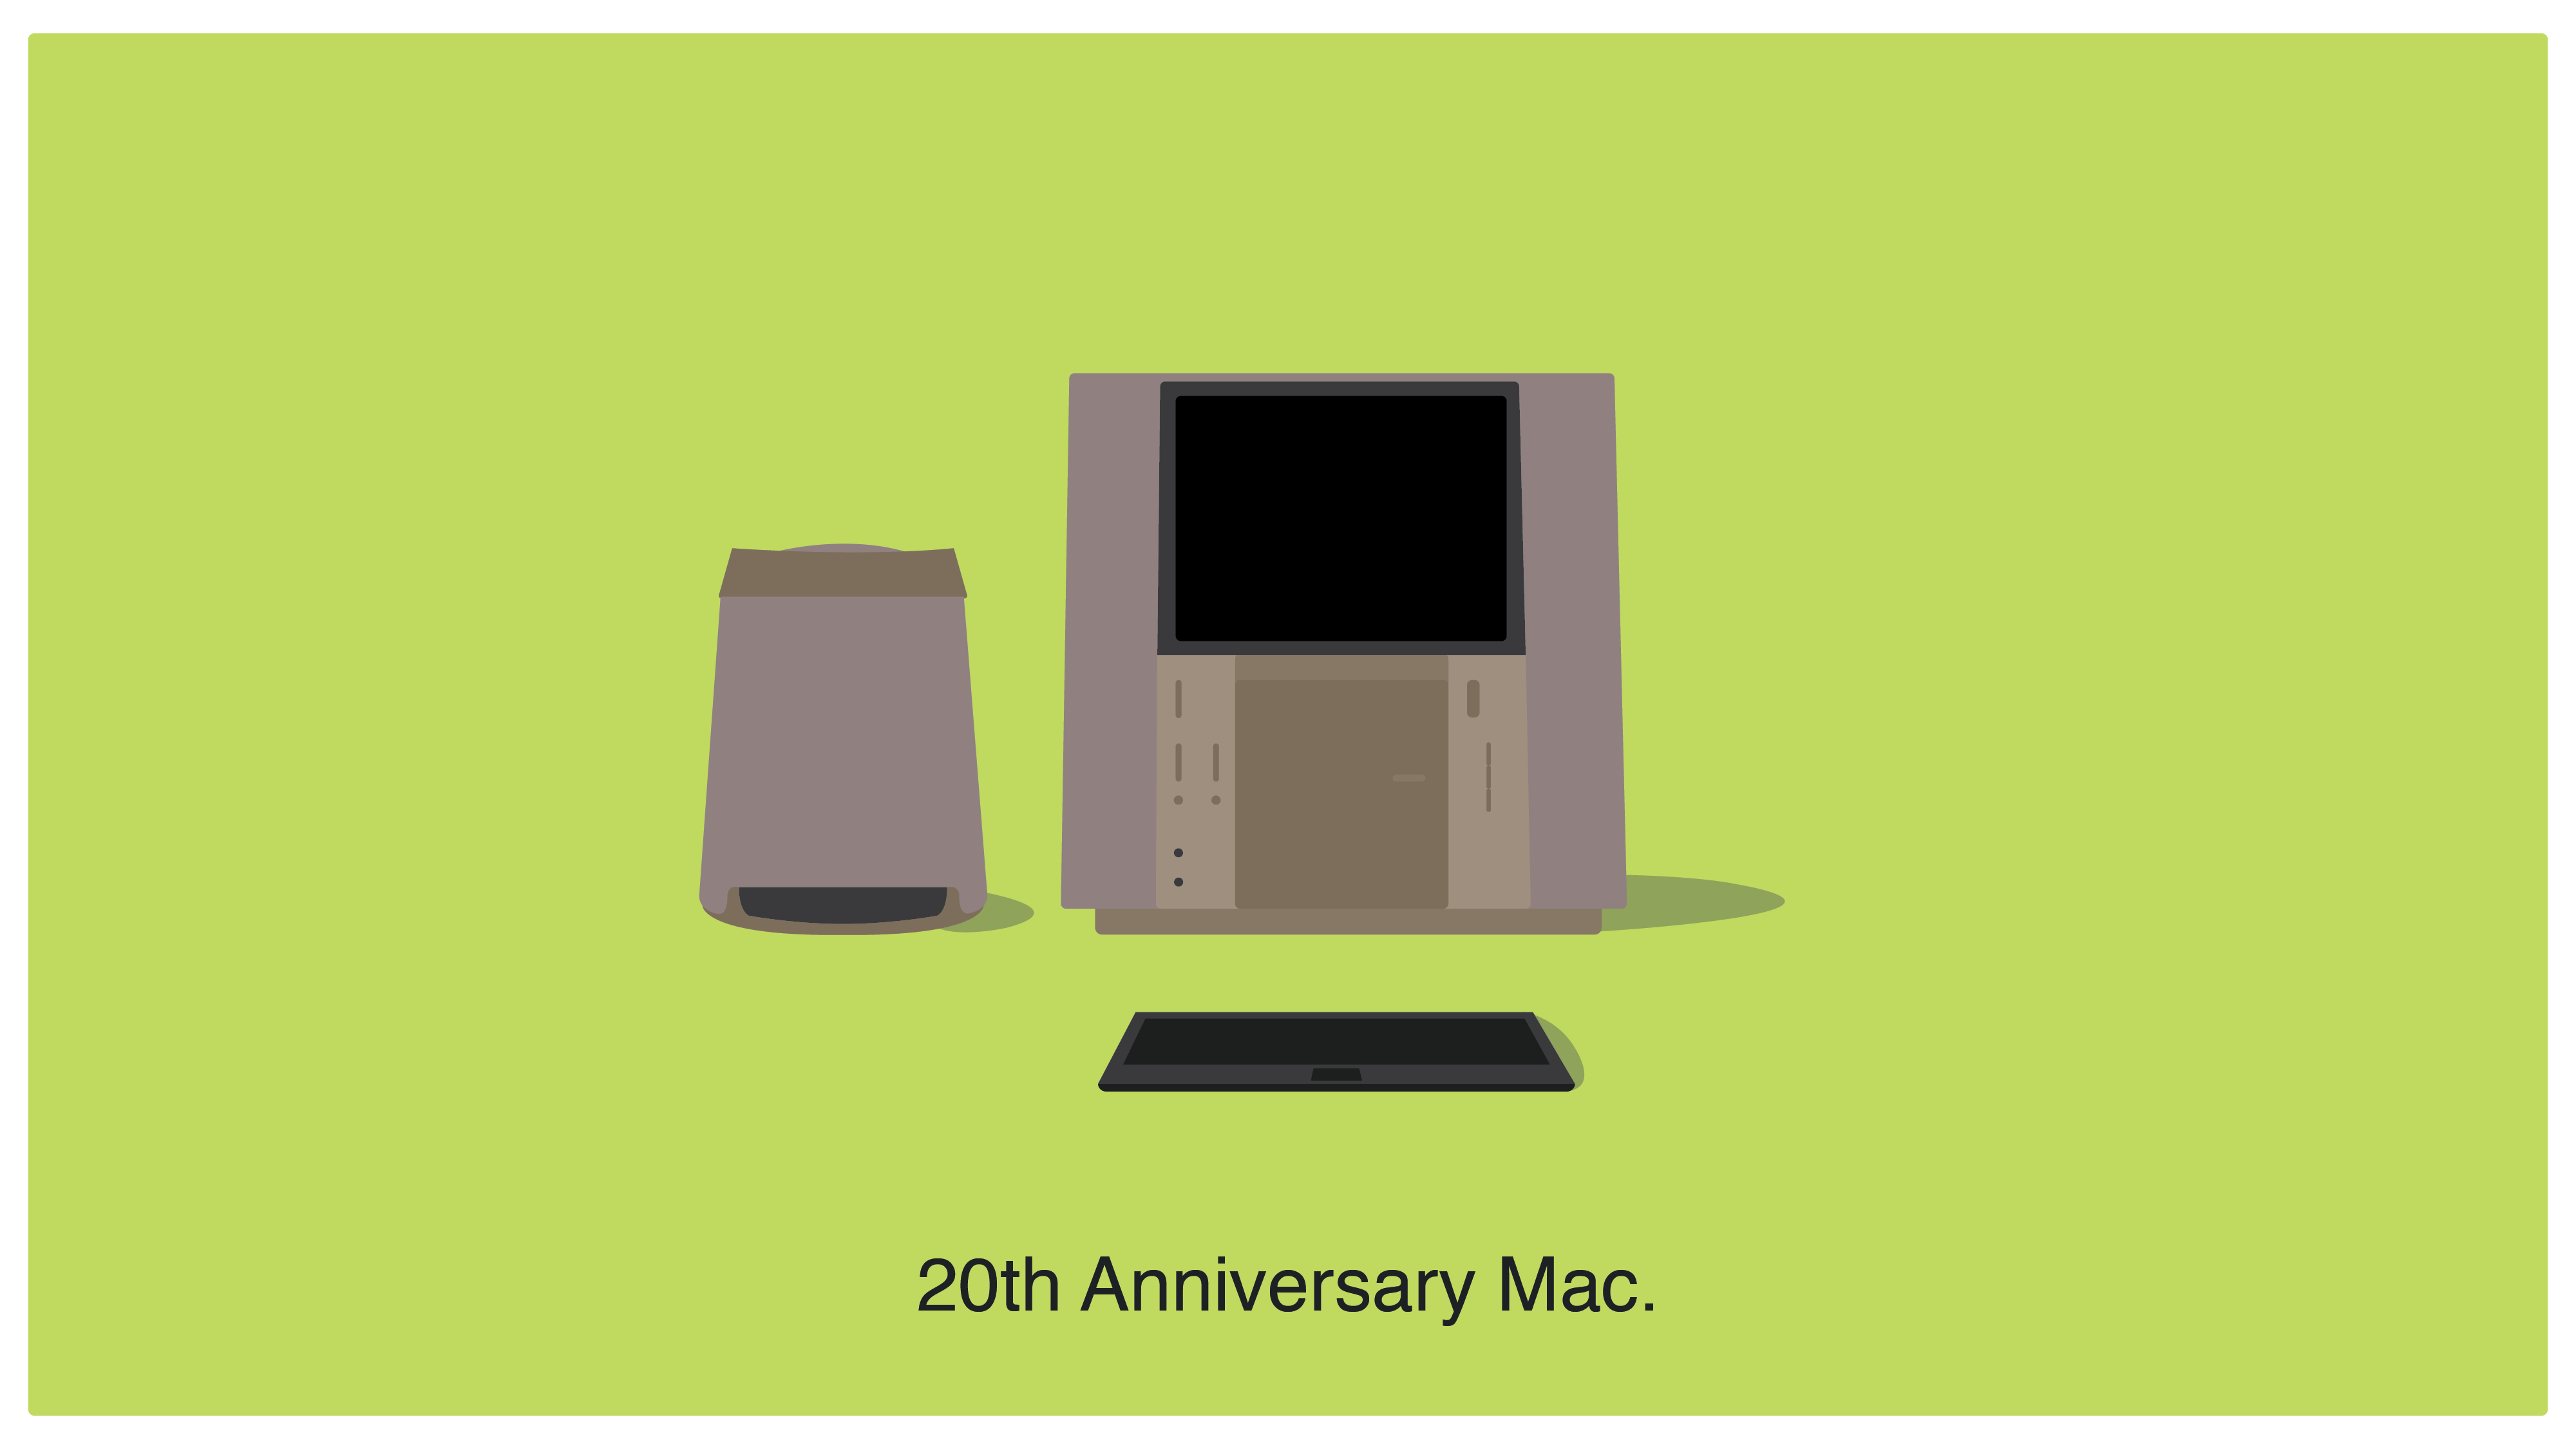
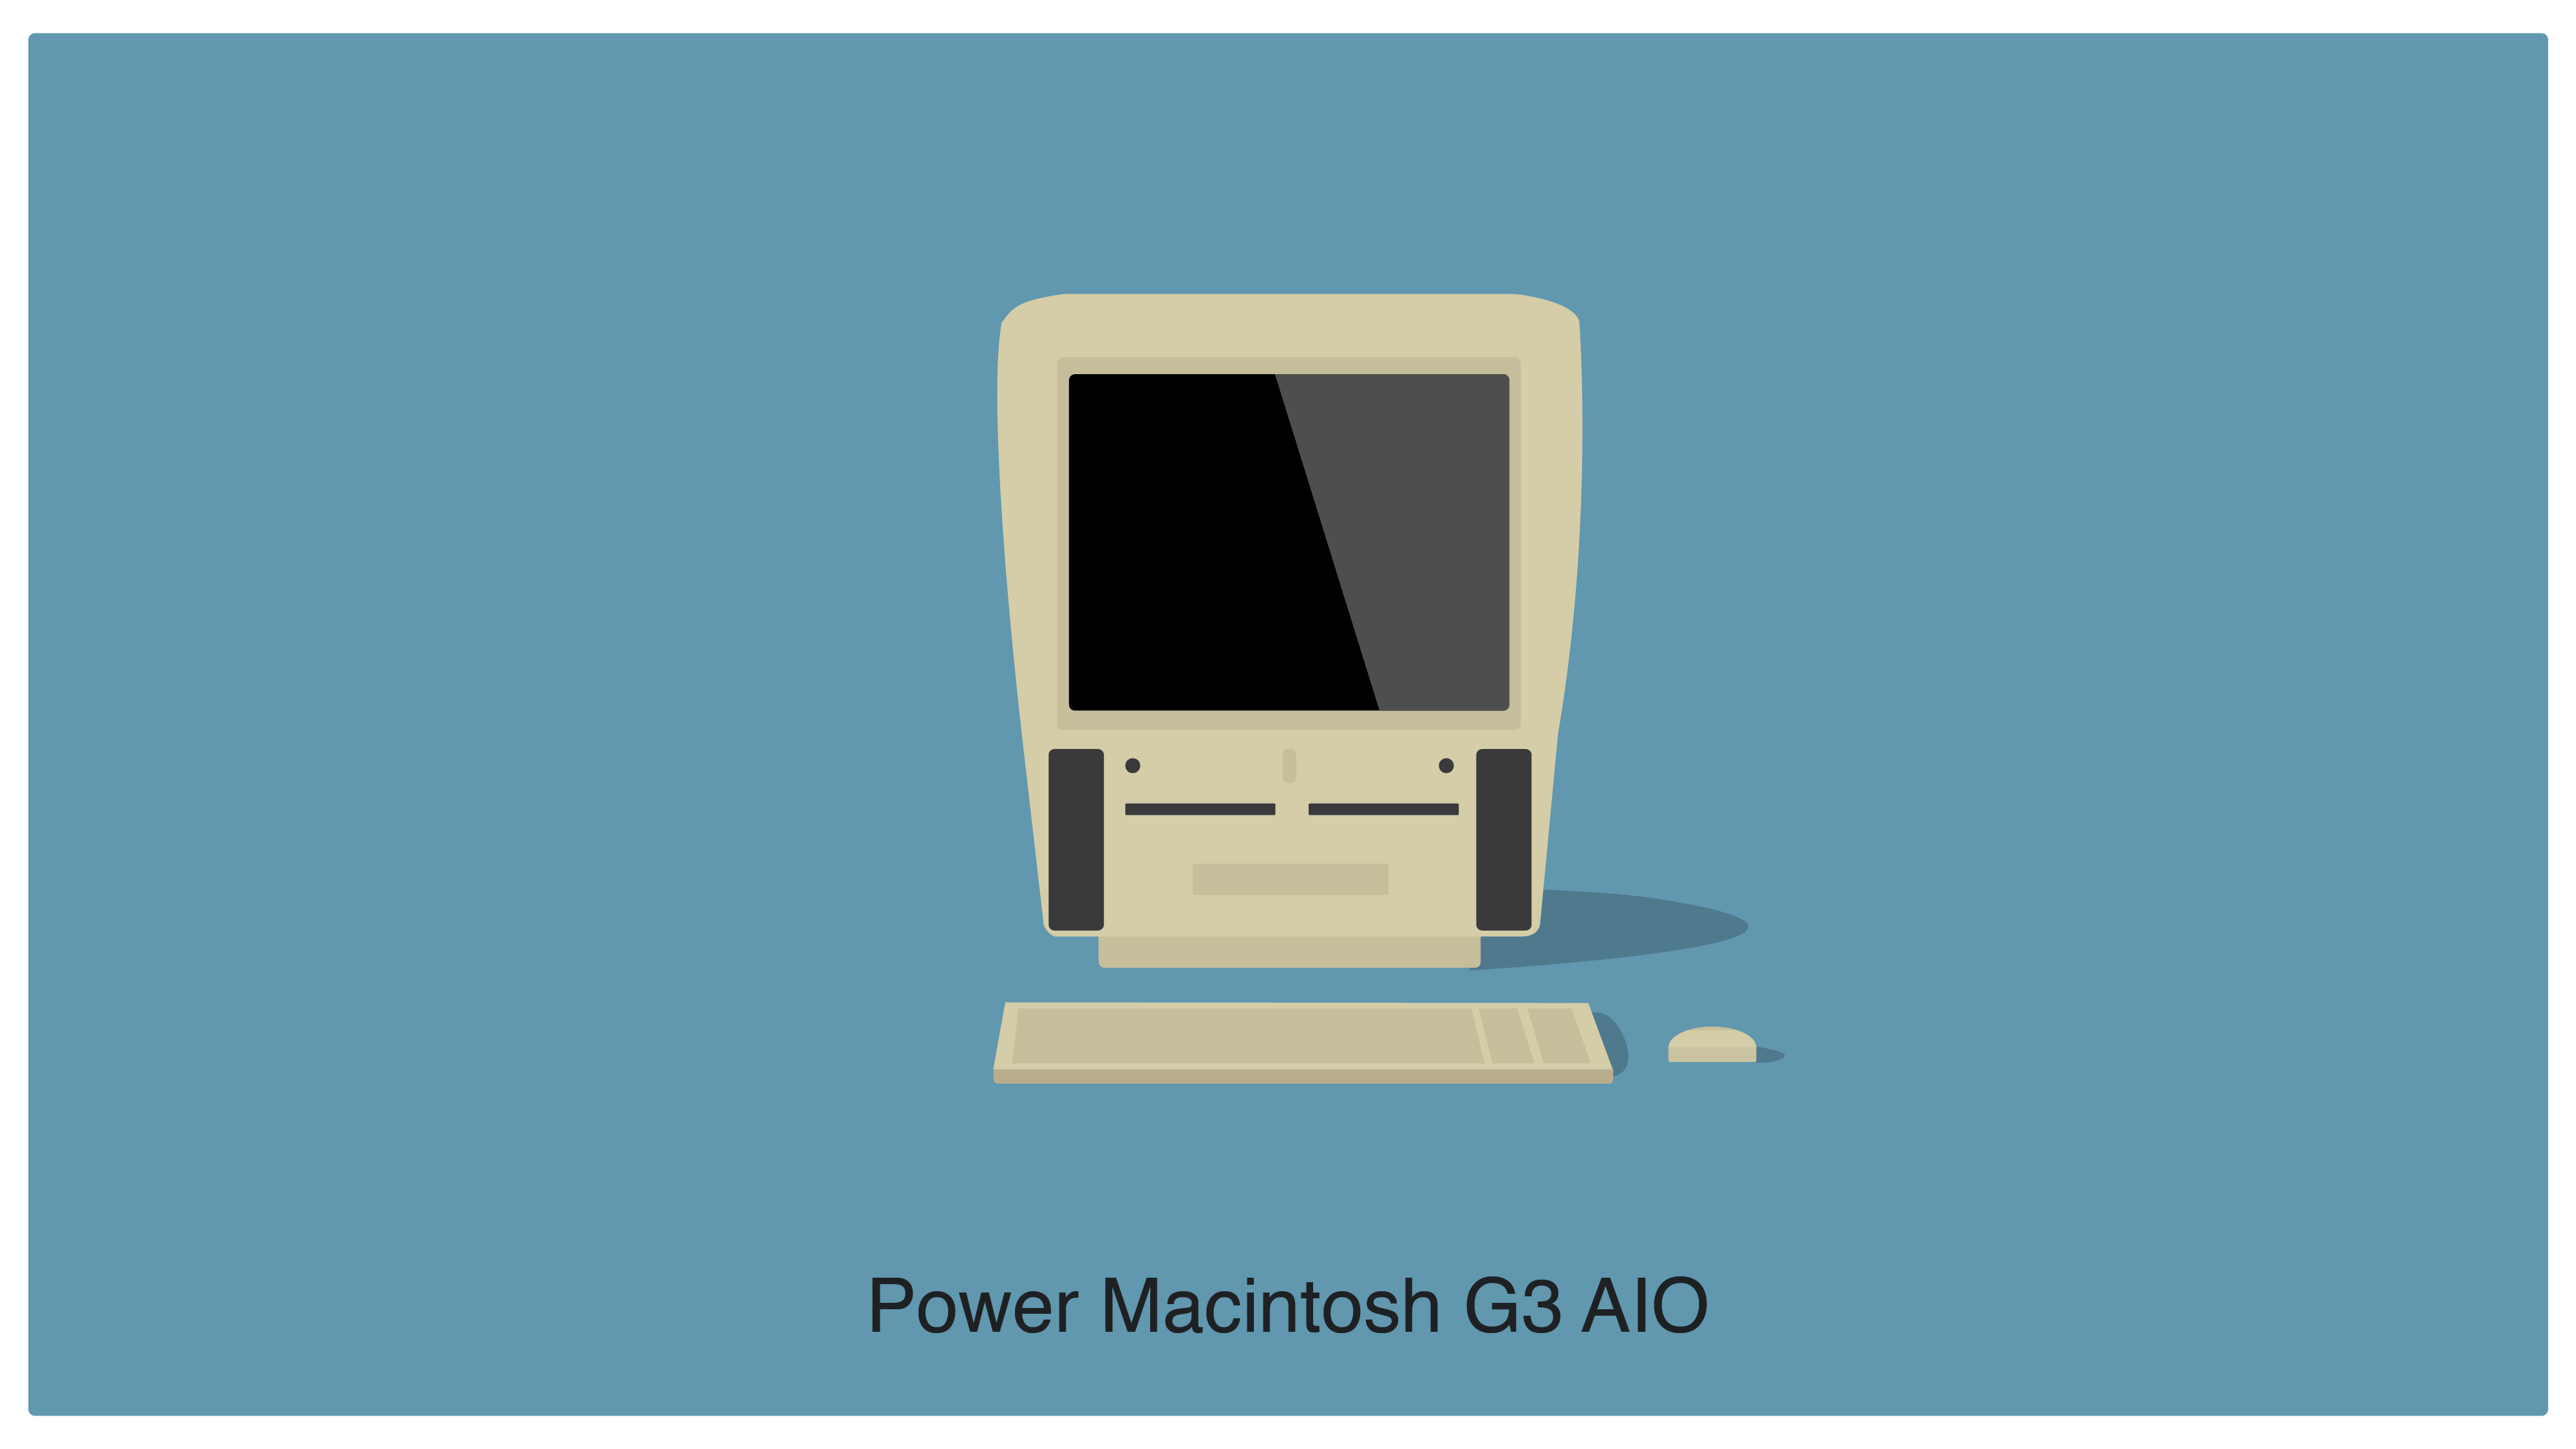
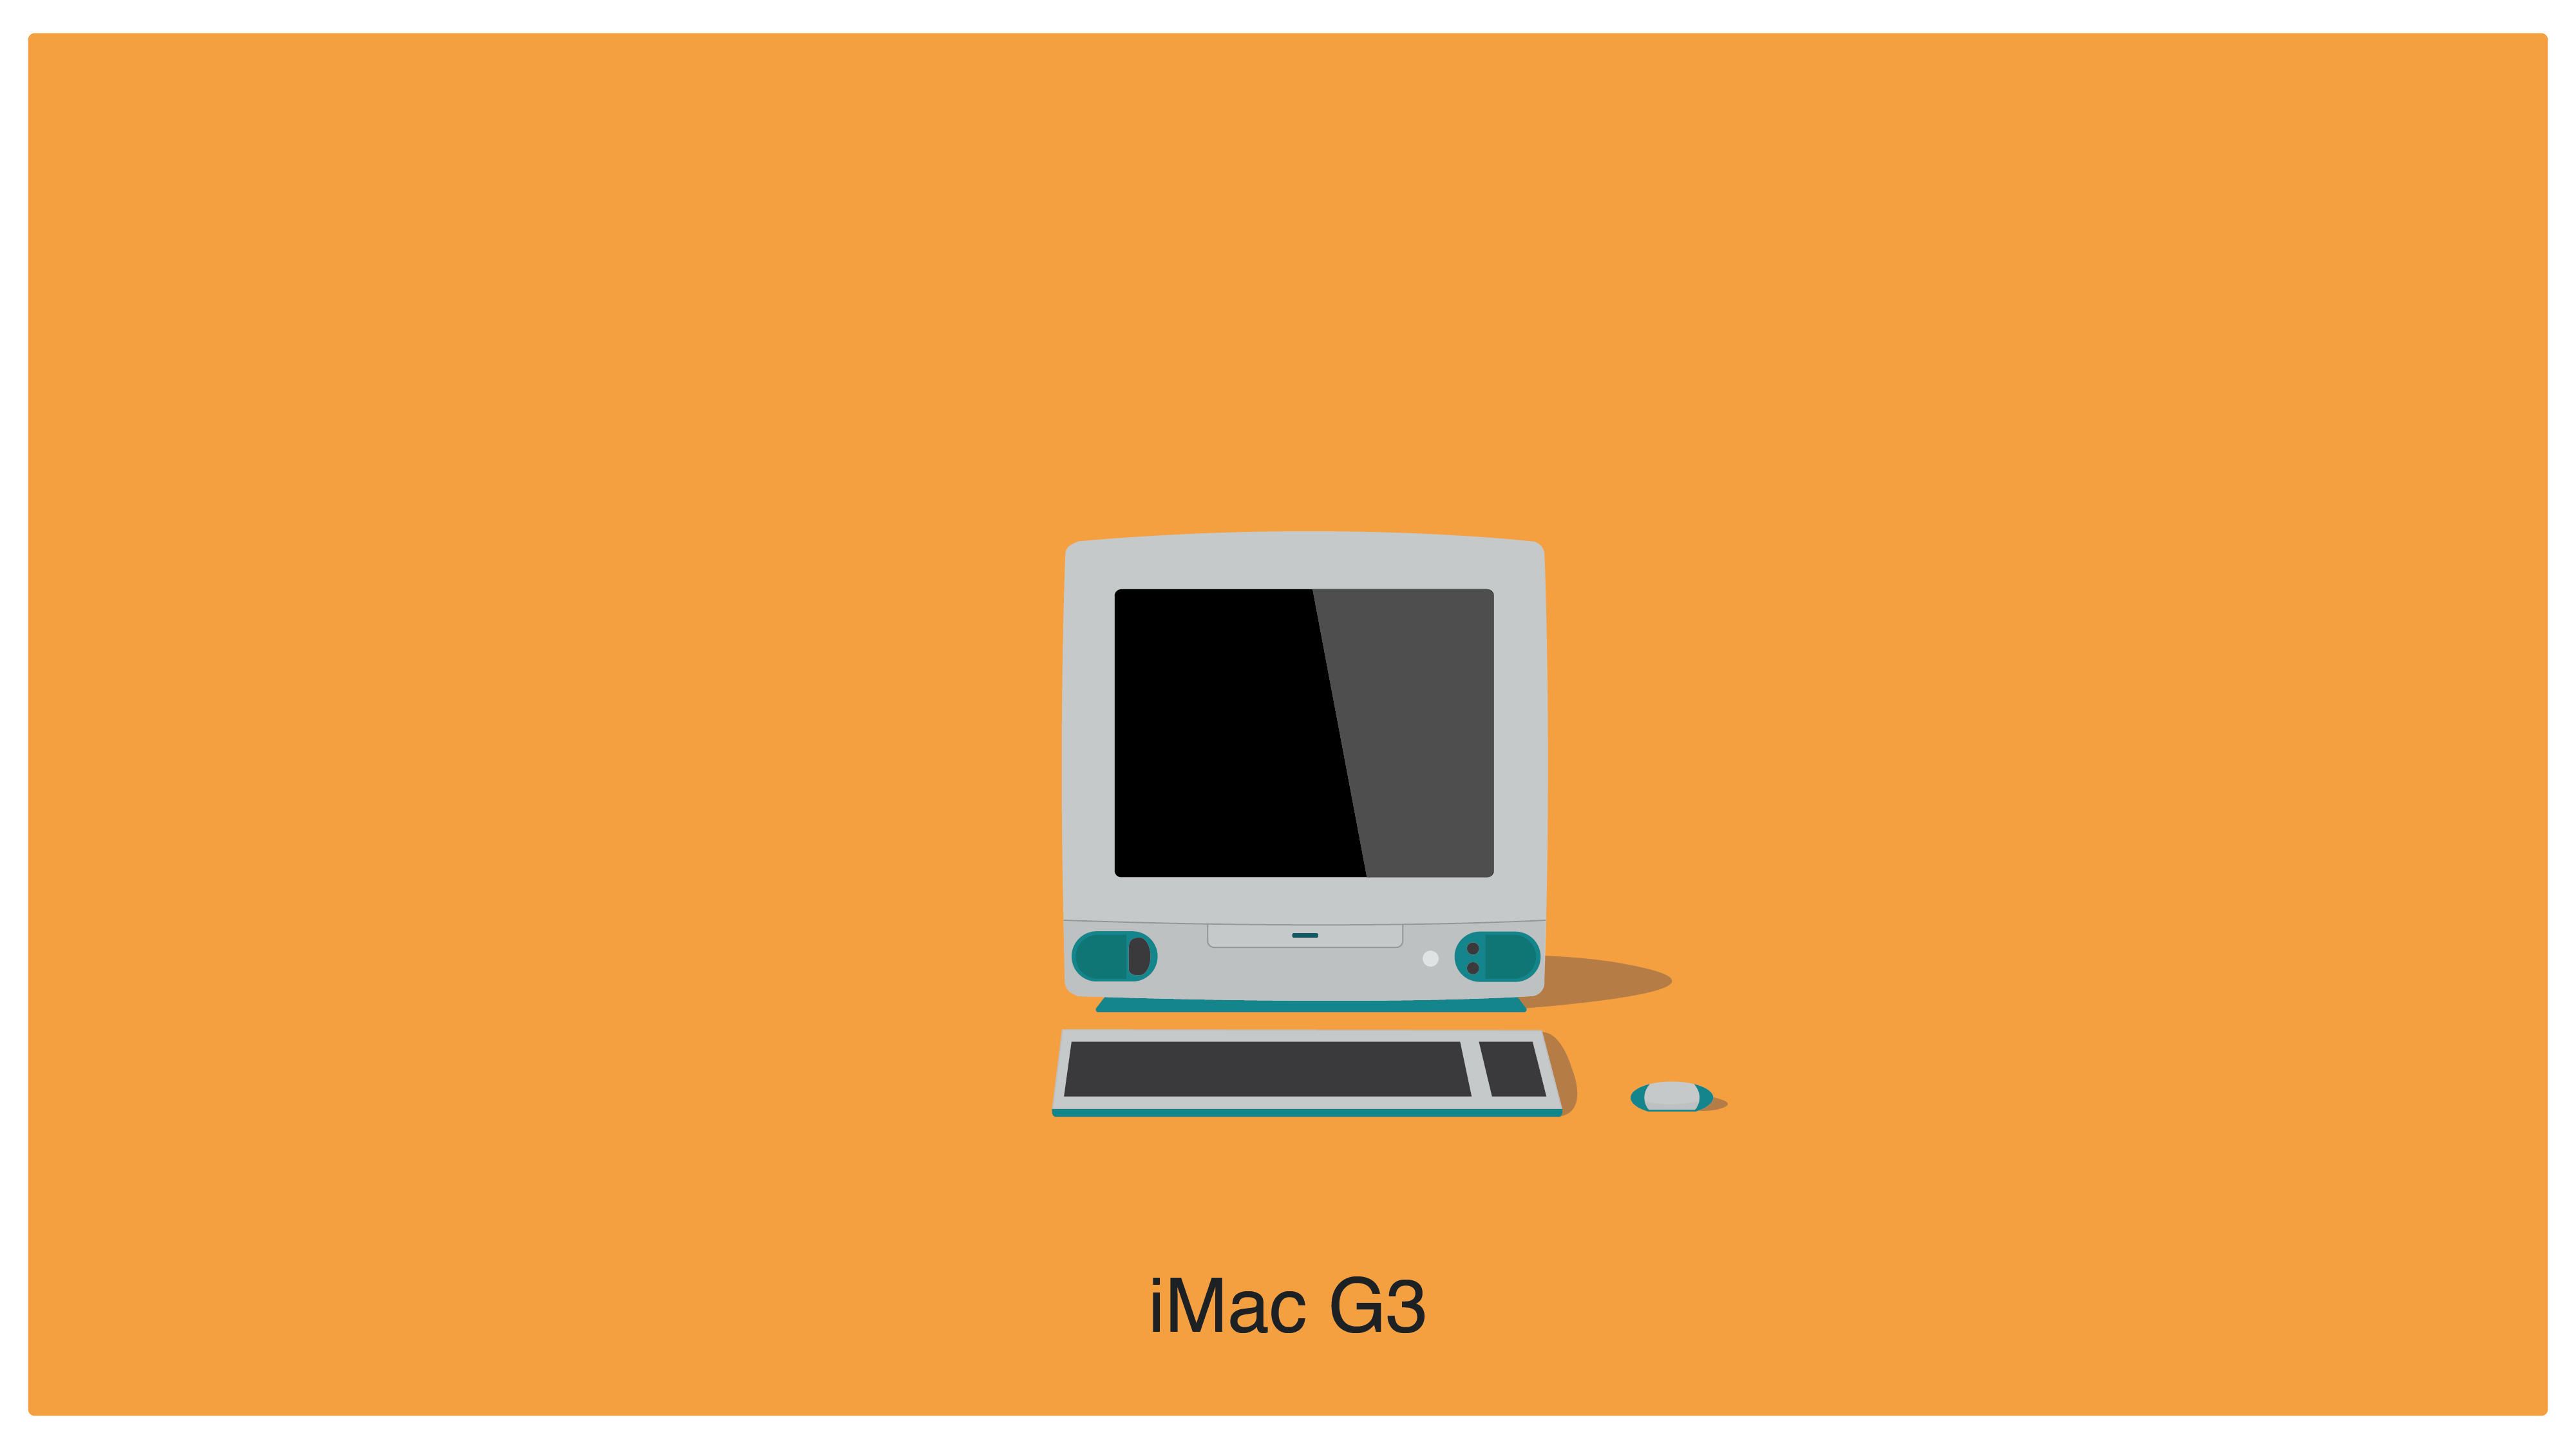
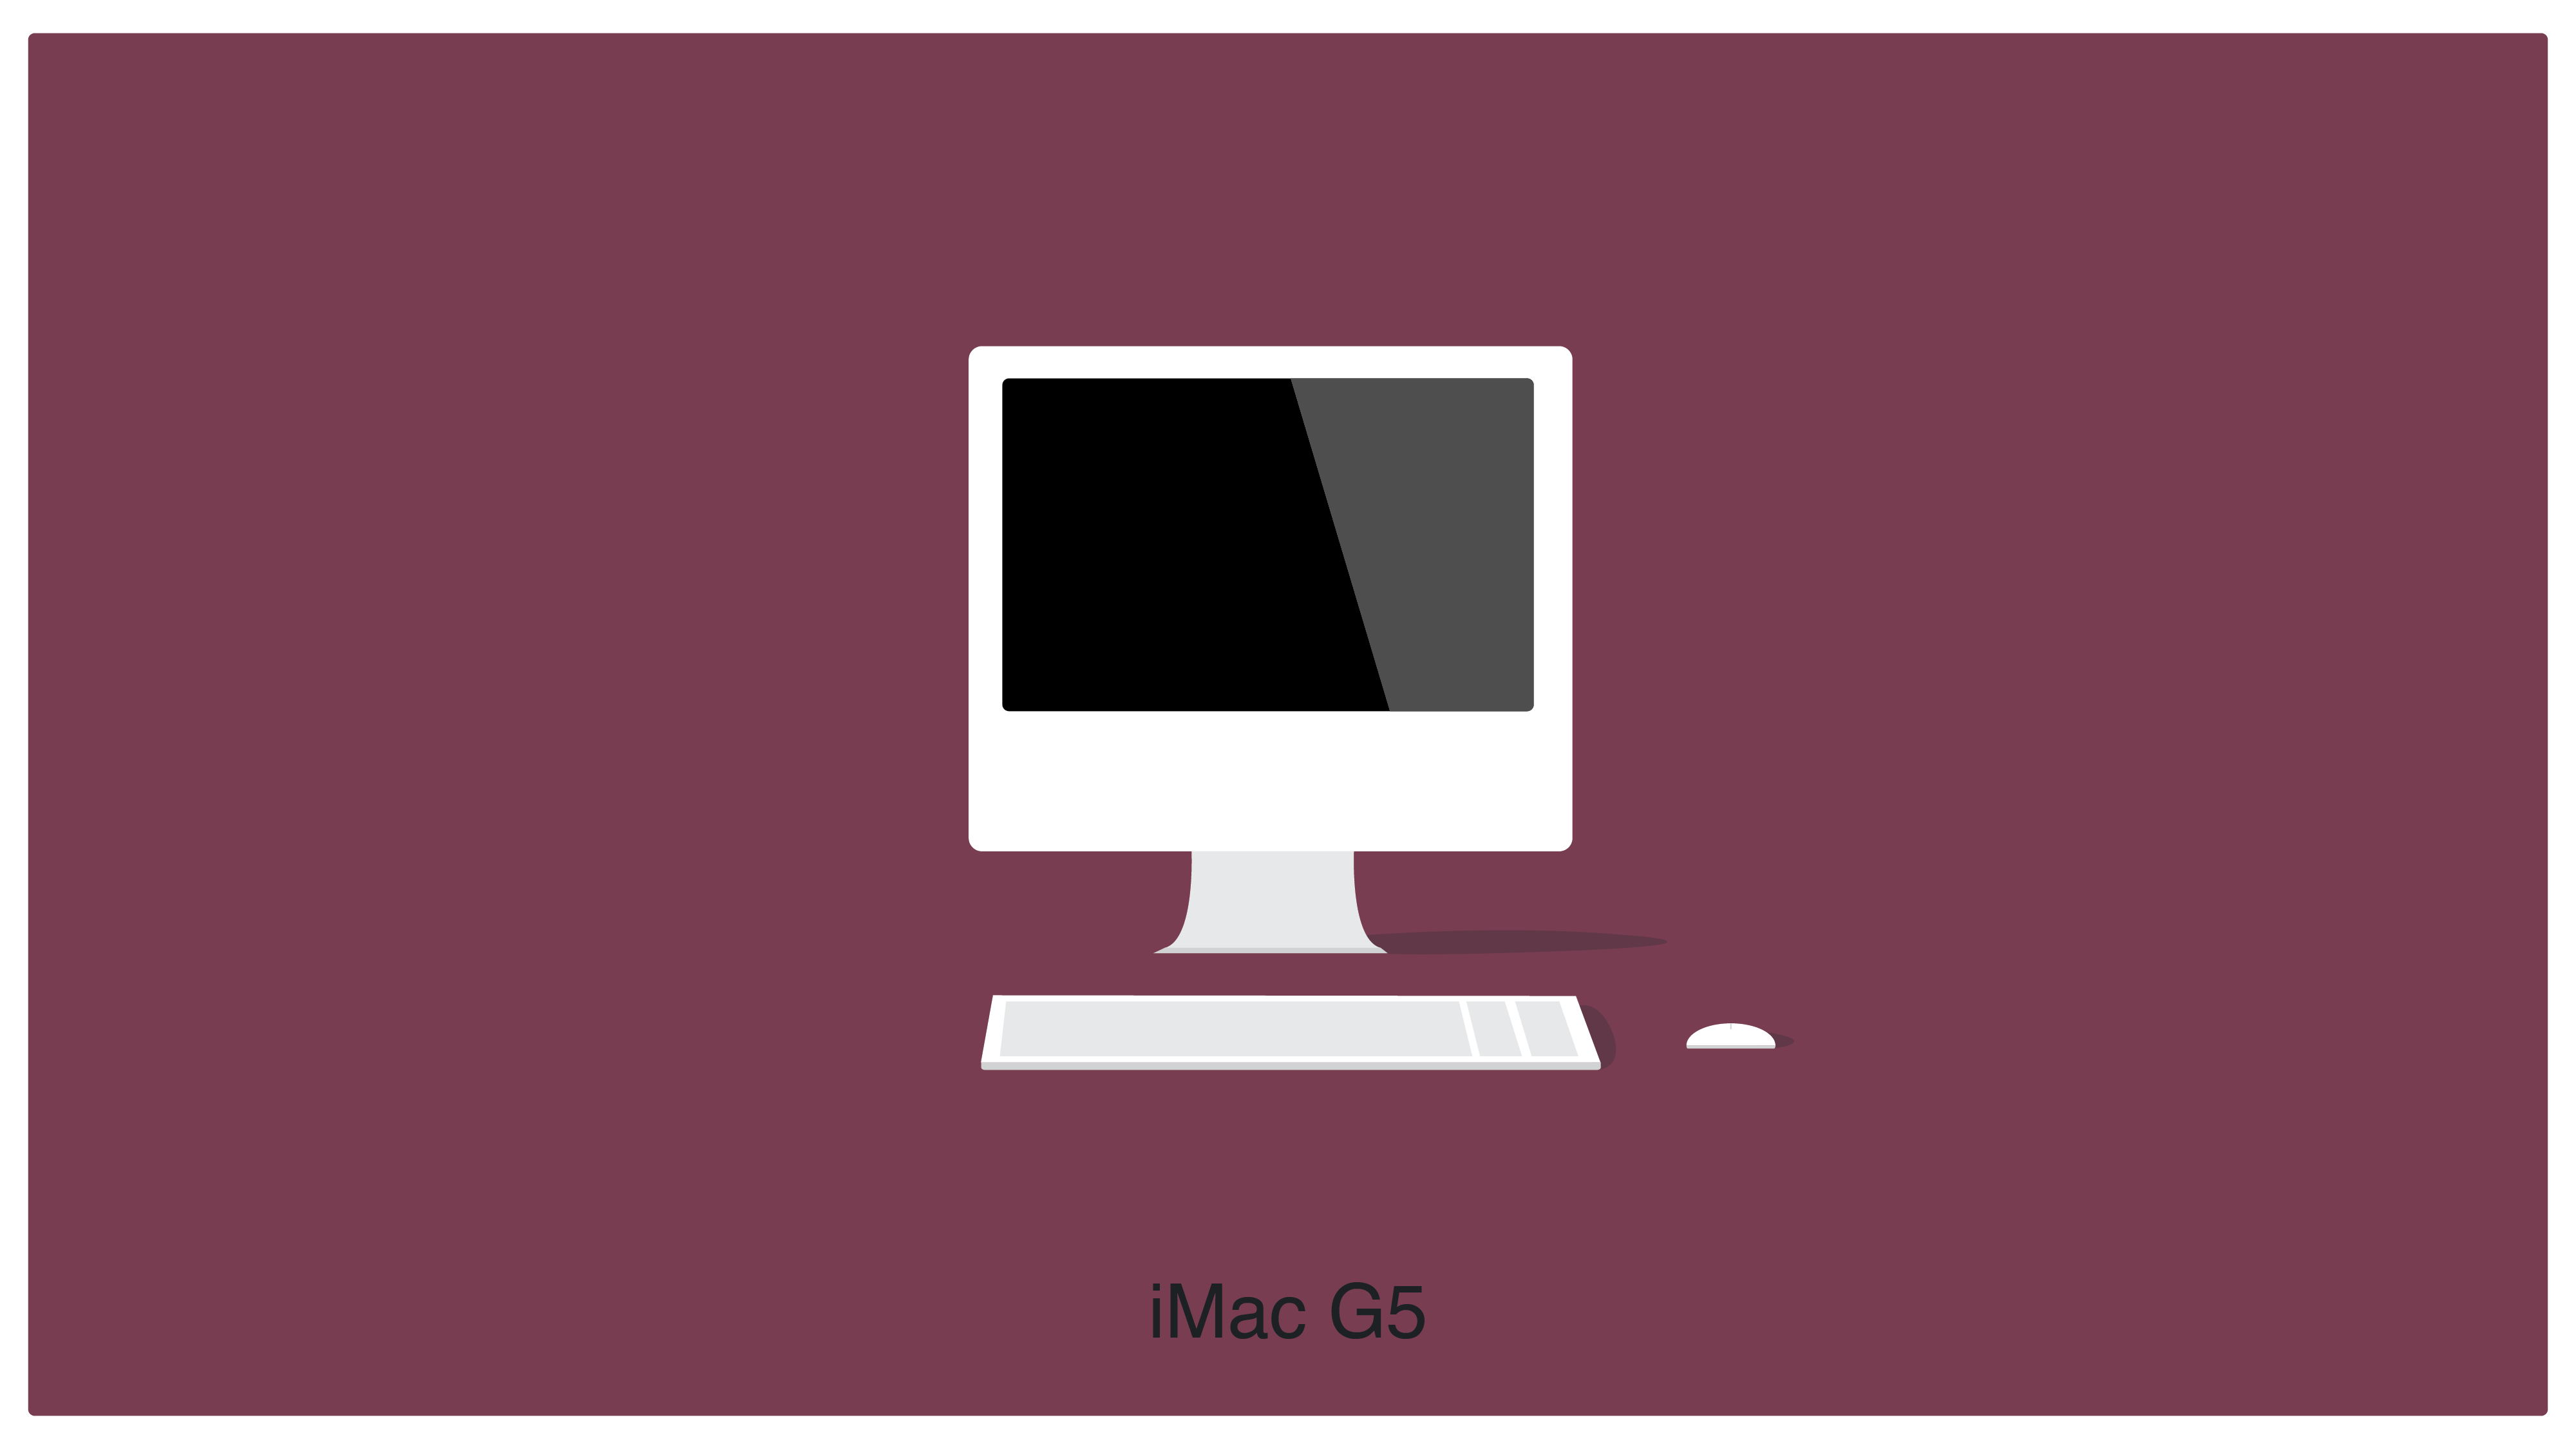
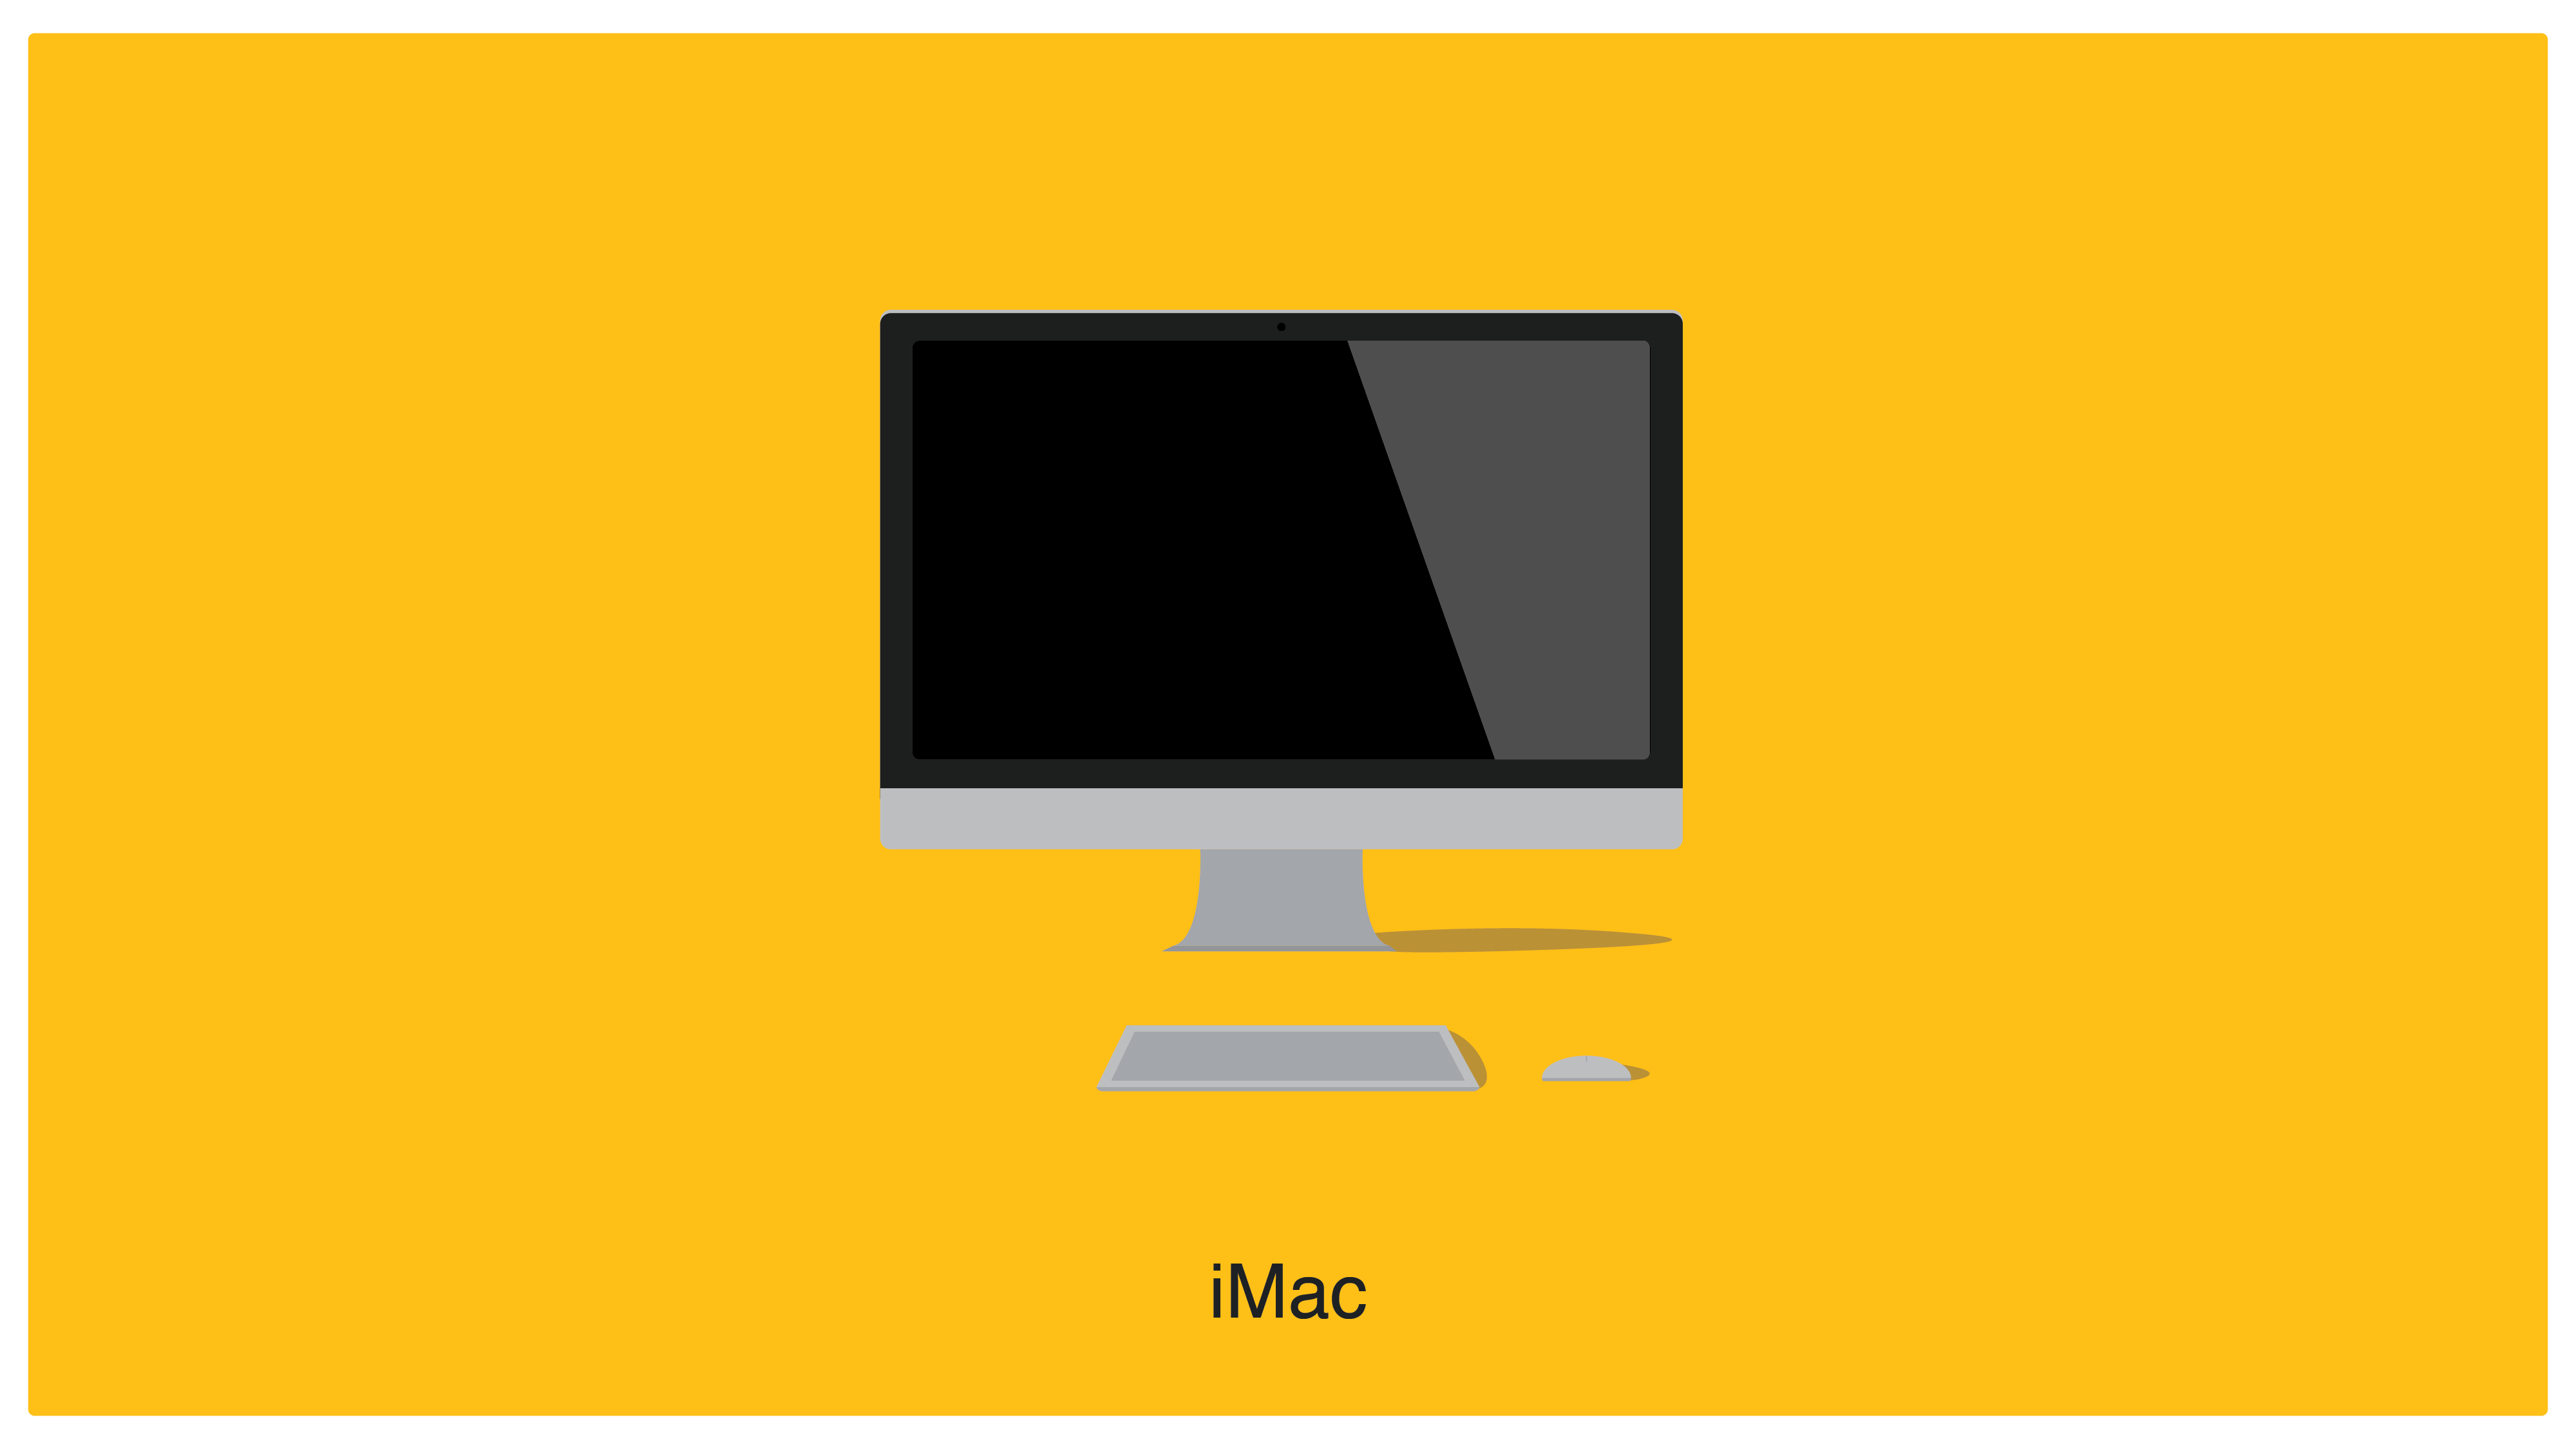
A series of illustrations documenting the Mac desktop, with the intention of simplifying and breaking it down to minimal forms. The drawings represent the evolution of the object between the years 1984 and 2013.


Pendulum Loop
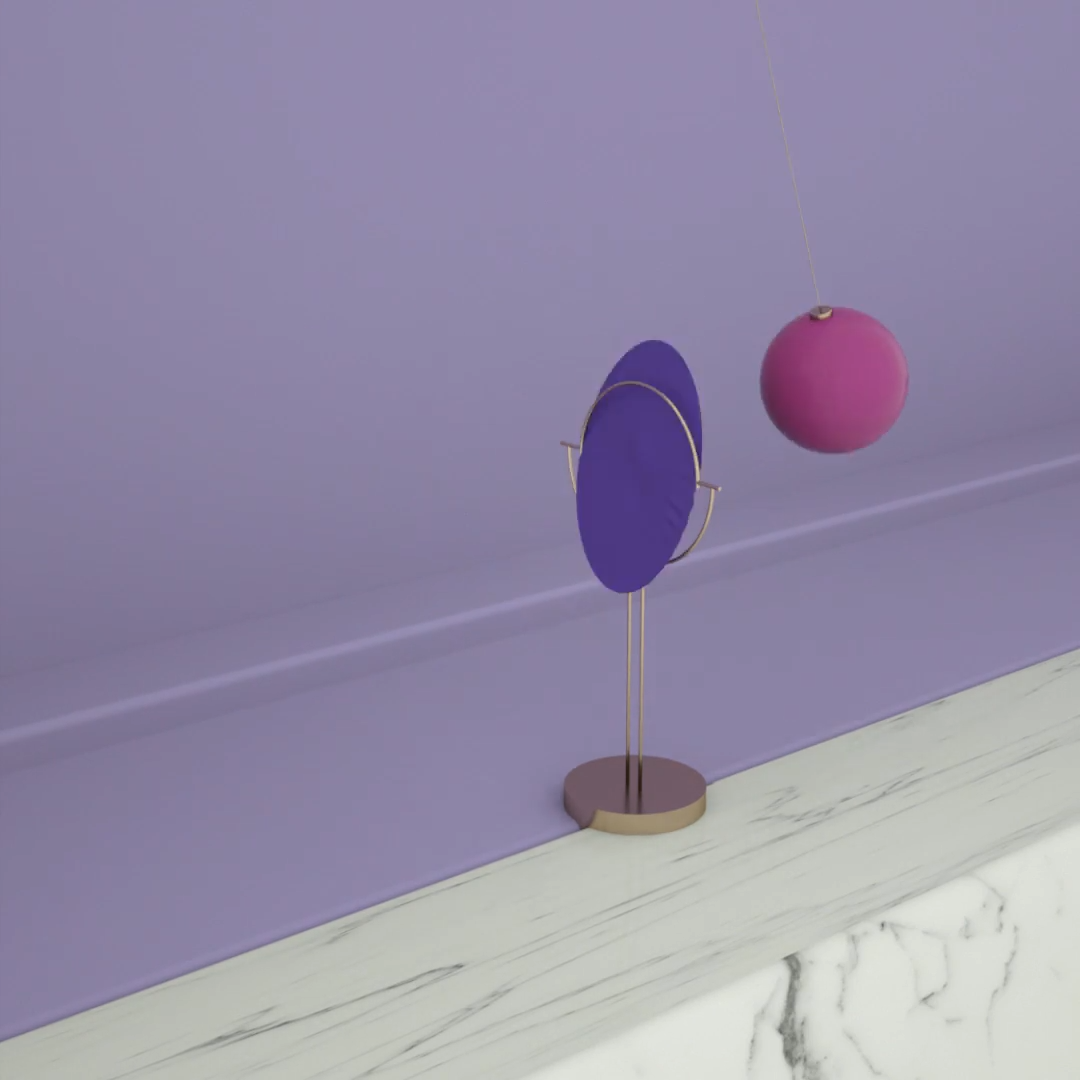
A series of looping studies exploring the pendulum. The same steady, rhythmic swing is traced through different forms, weights and compositions, each loop folding motion back into itself.
Fossil Fuel Data Viz
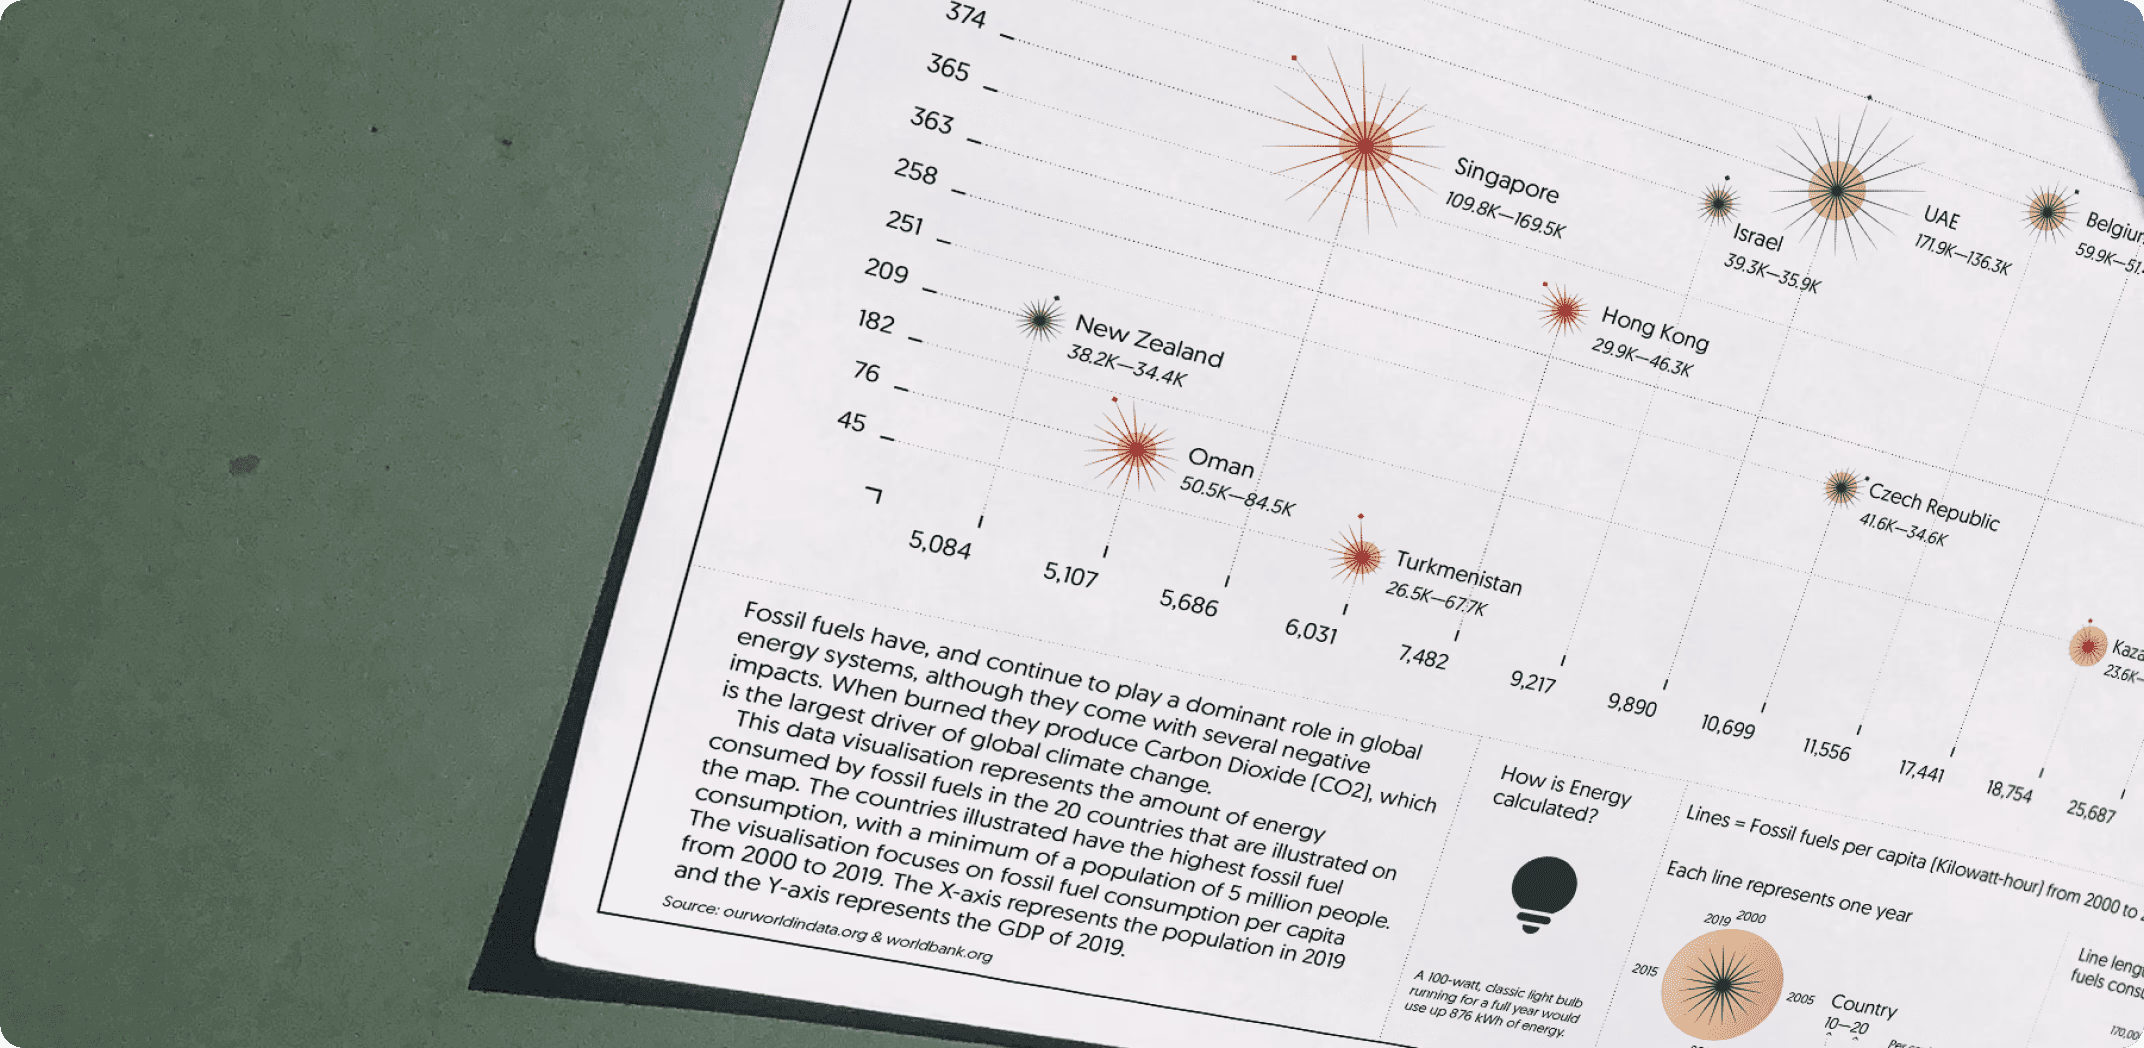
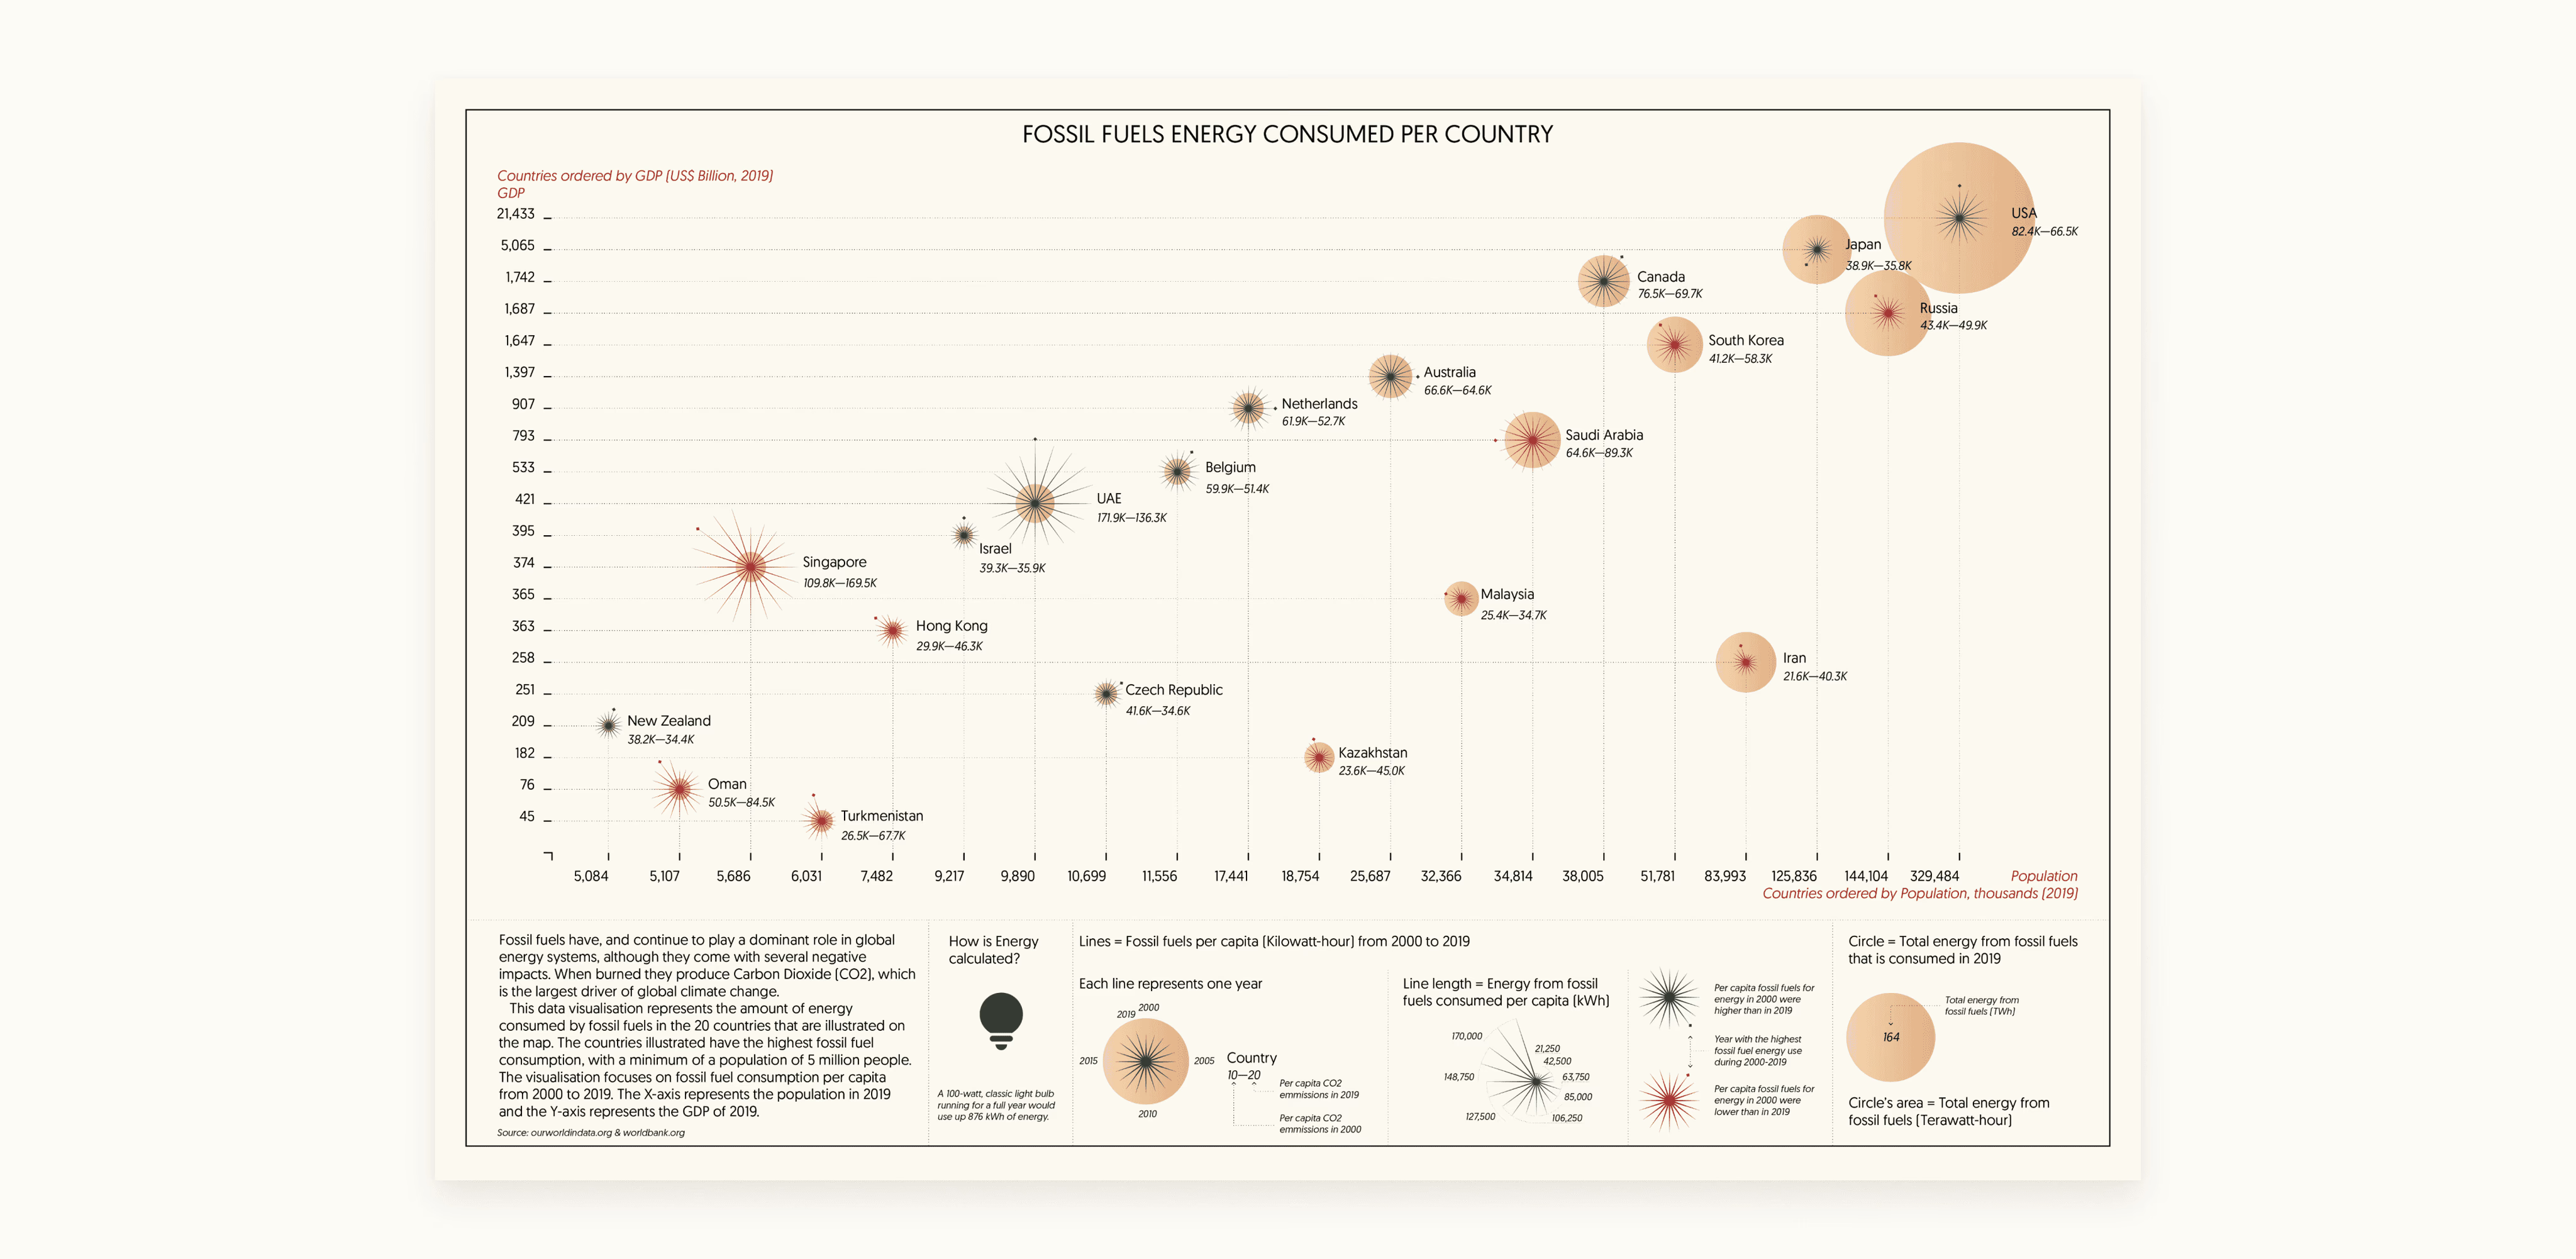
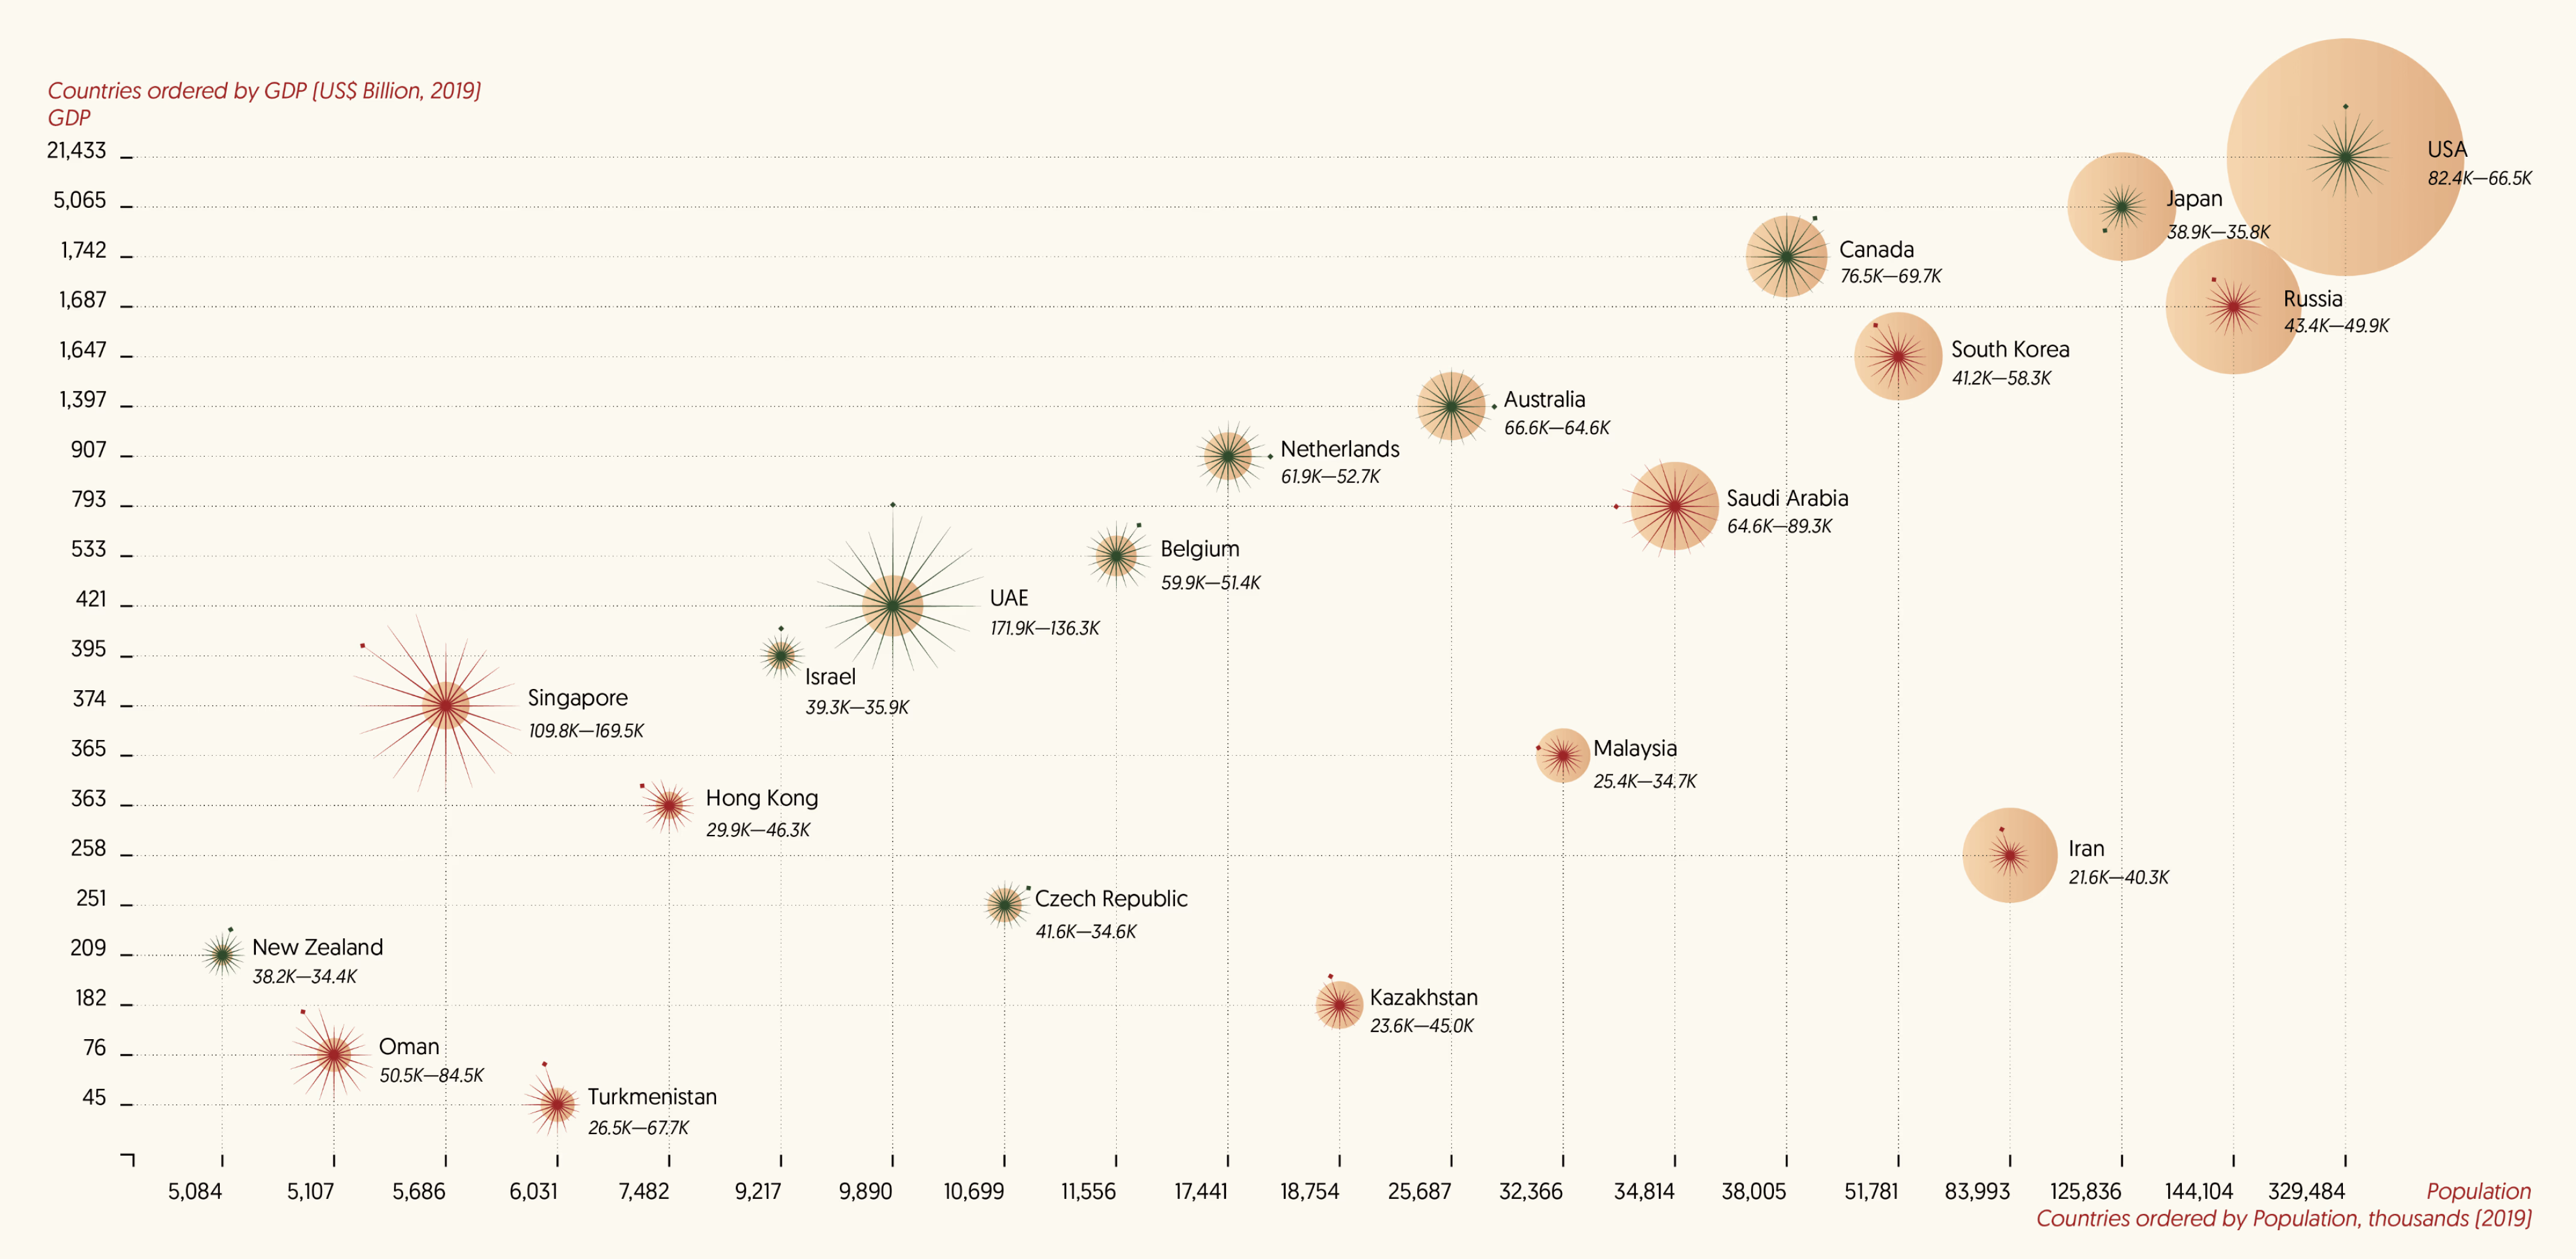
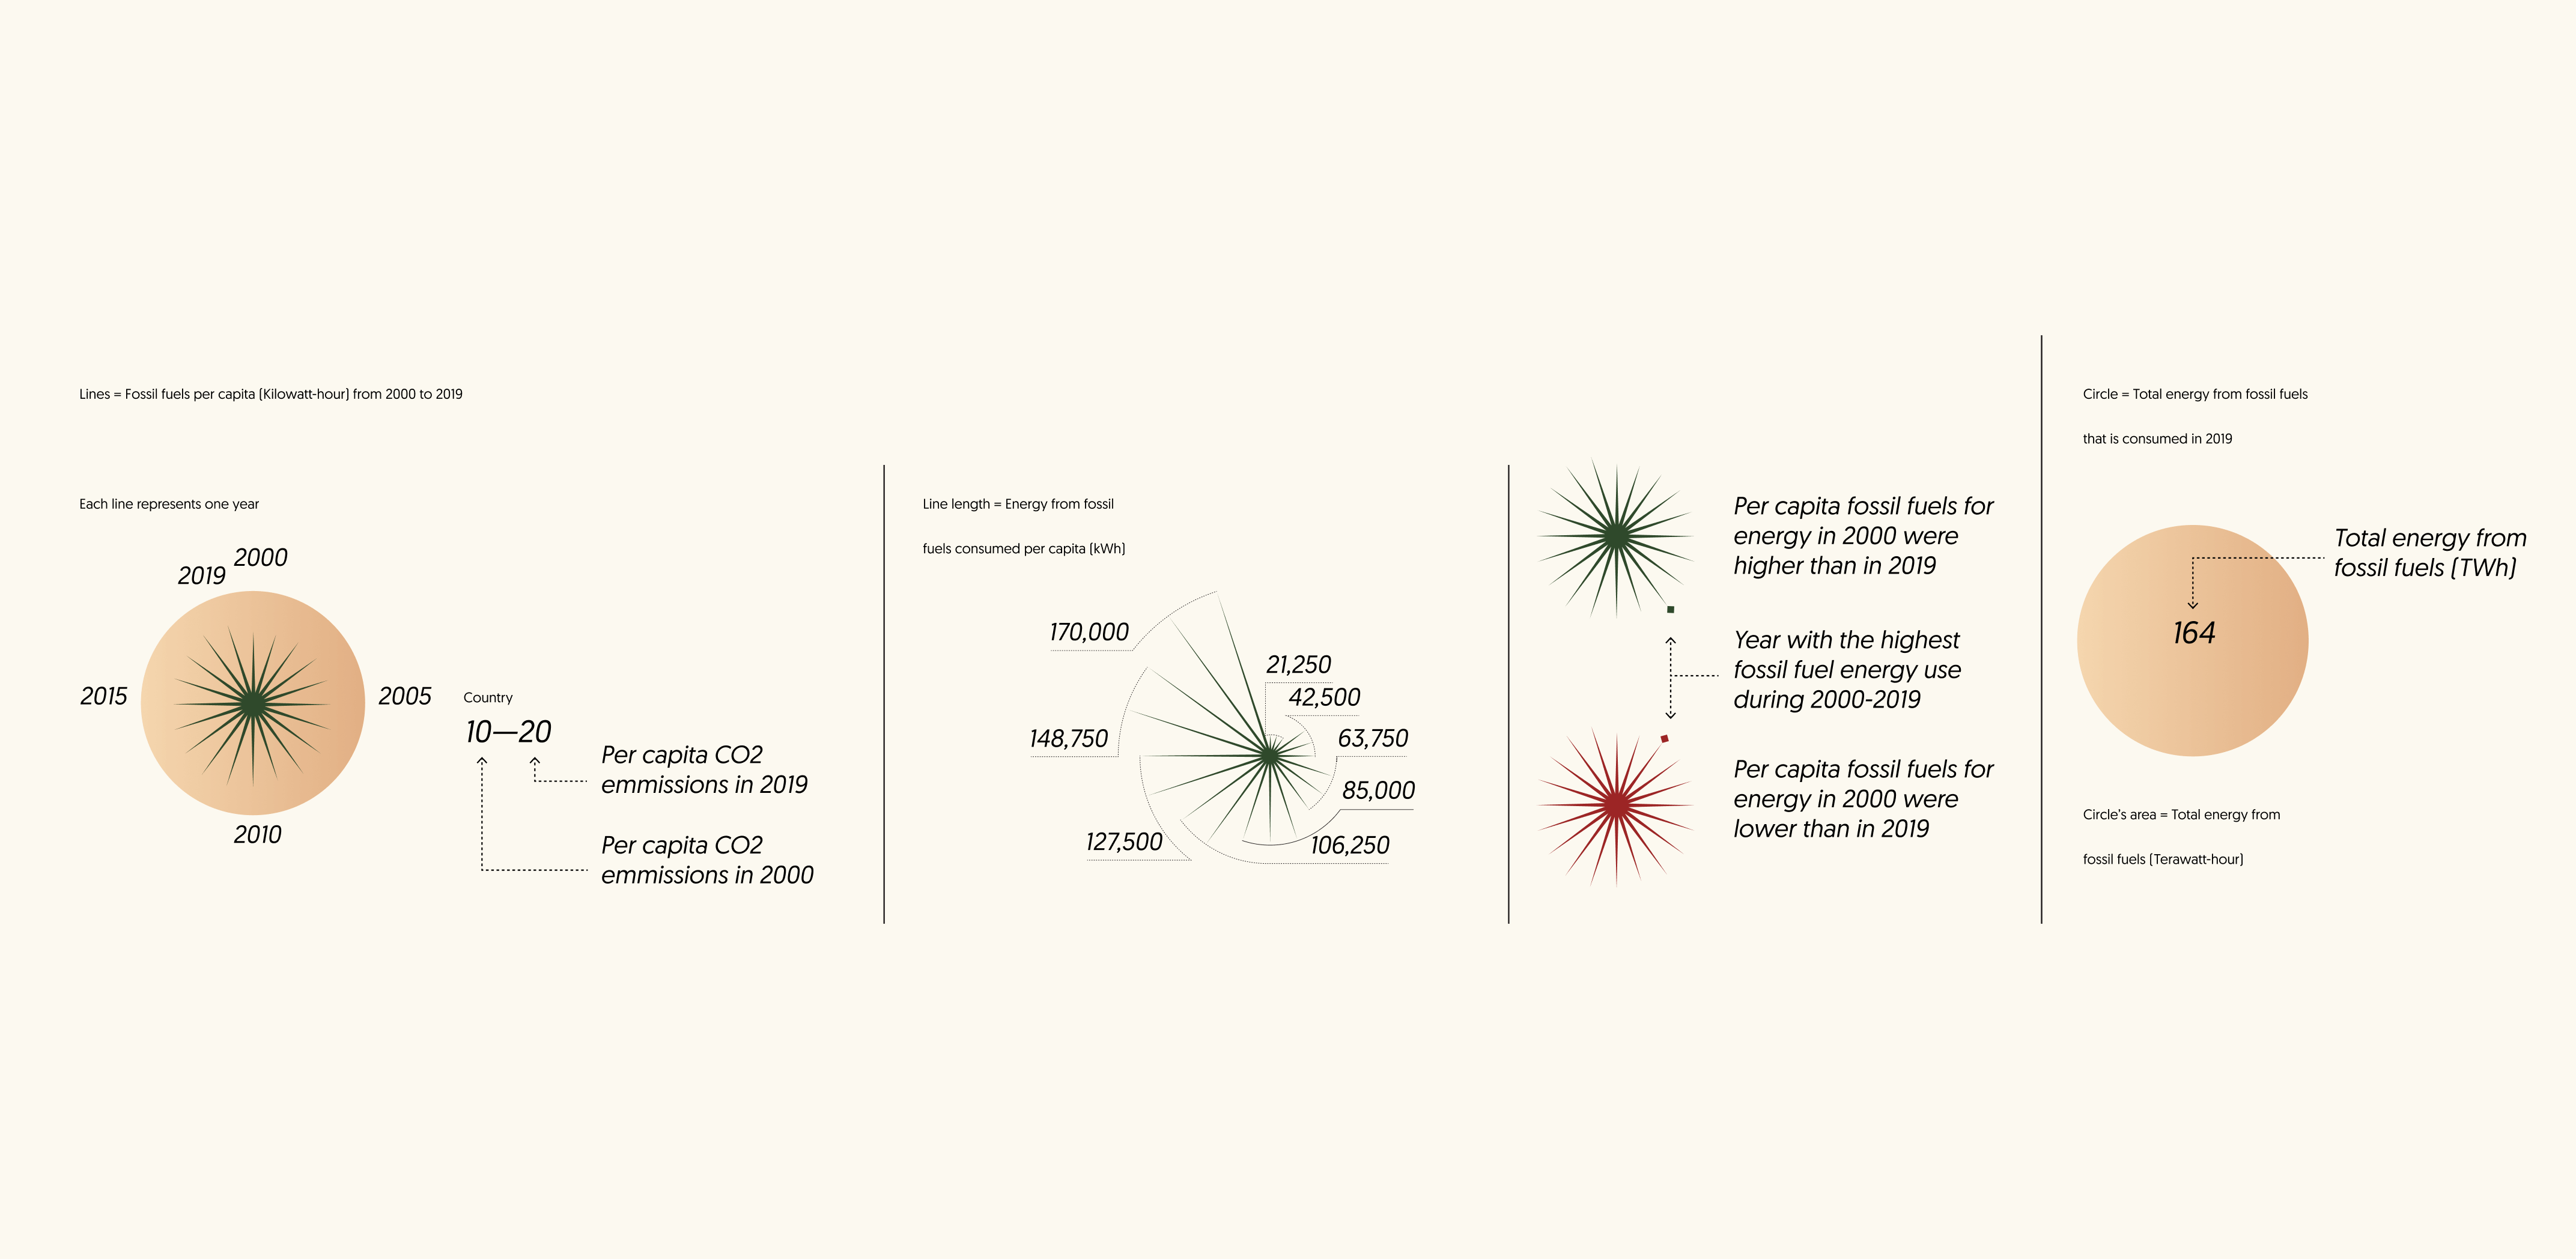
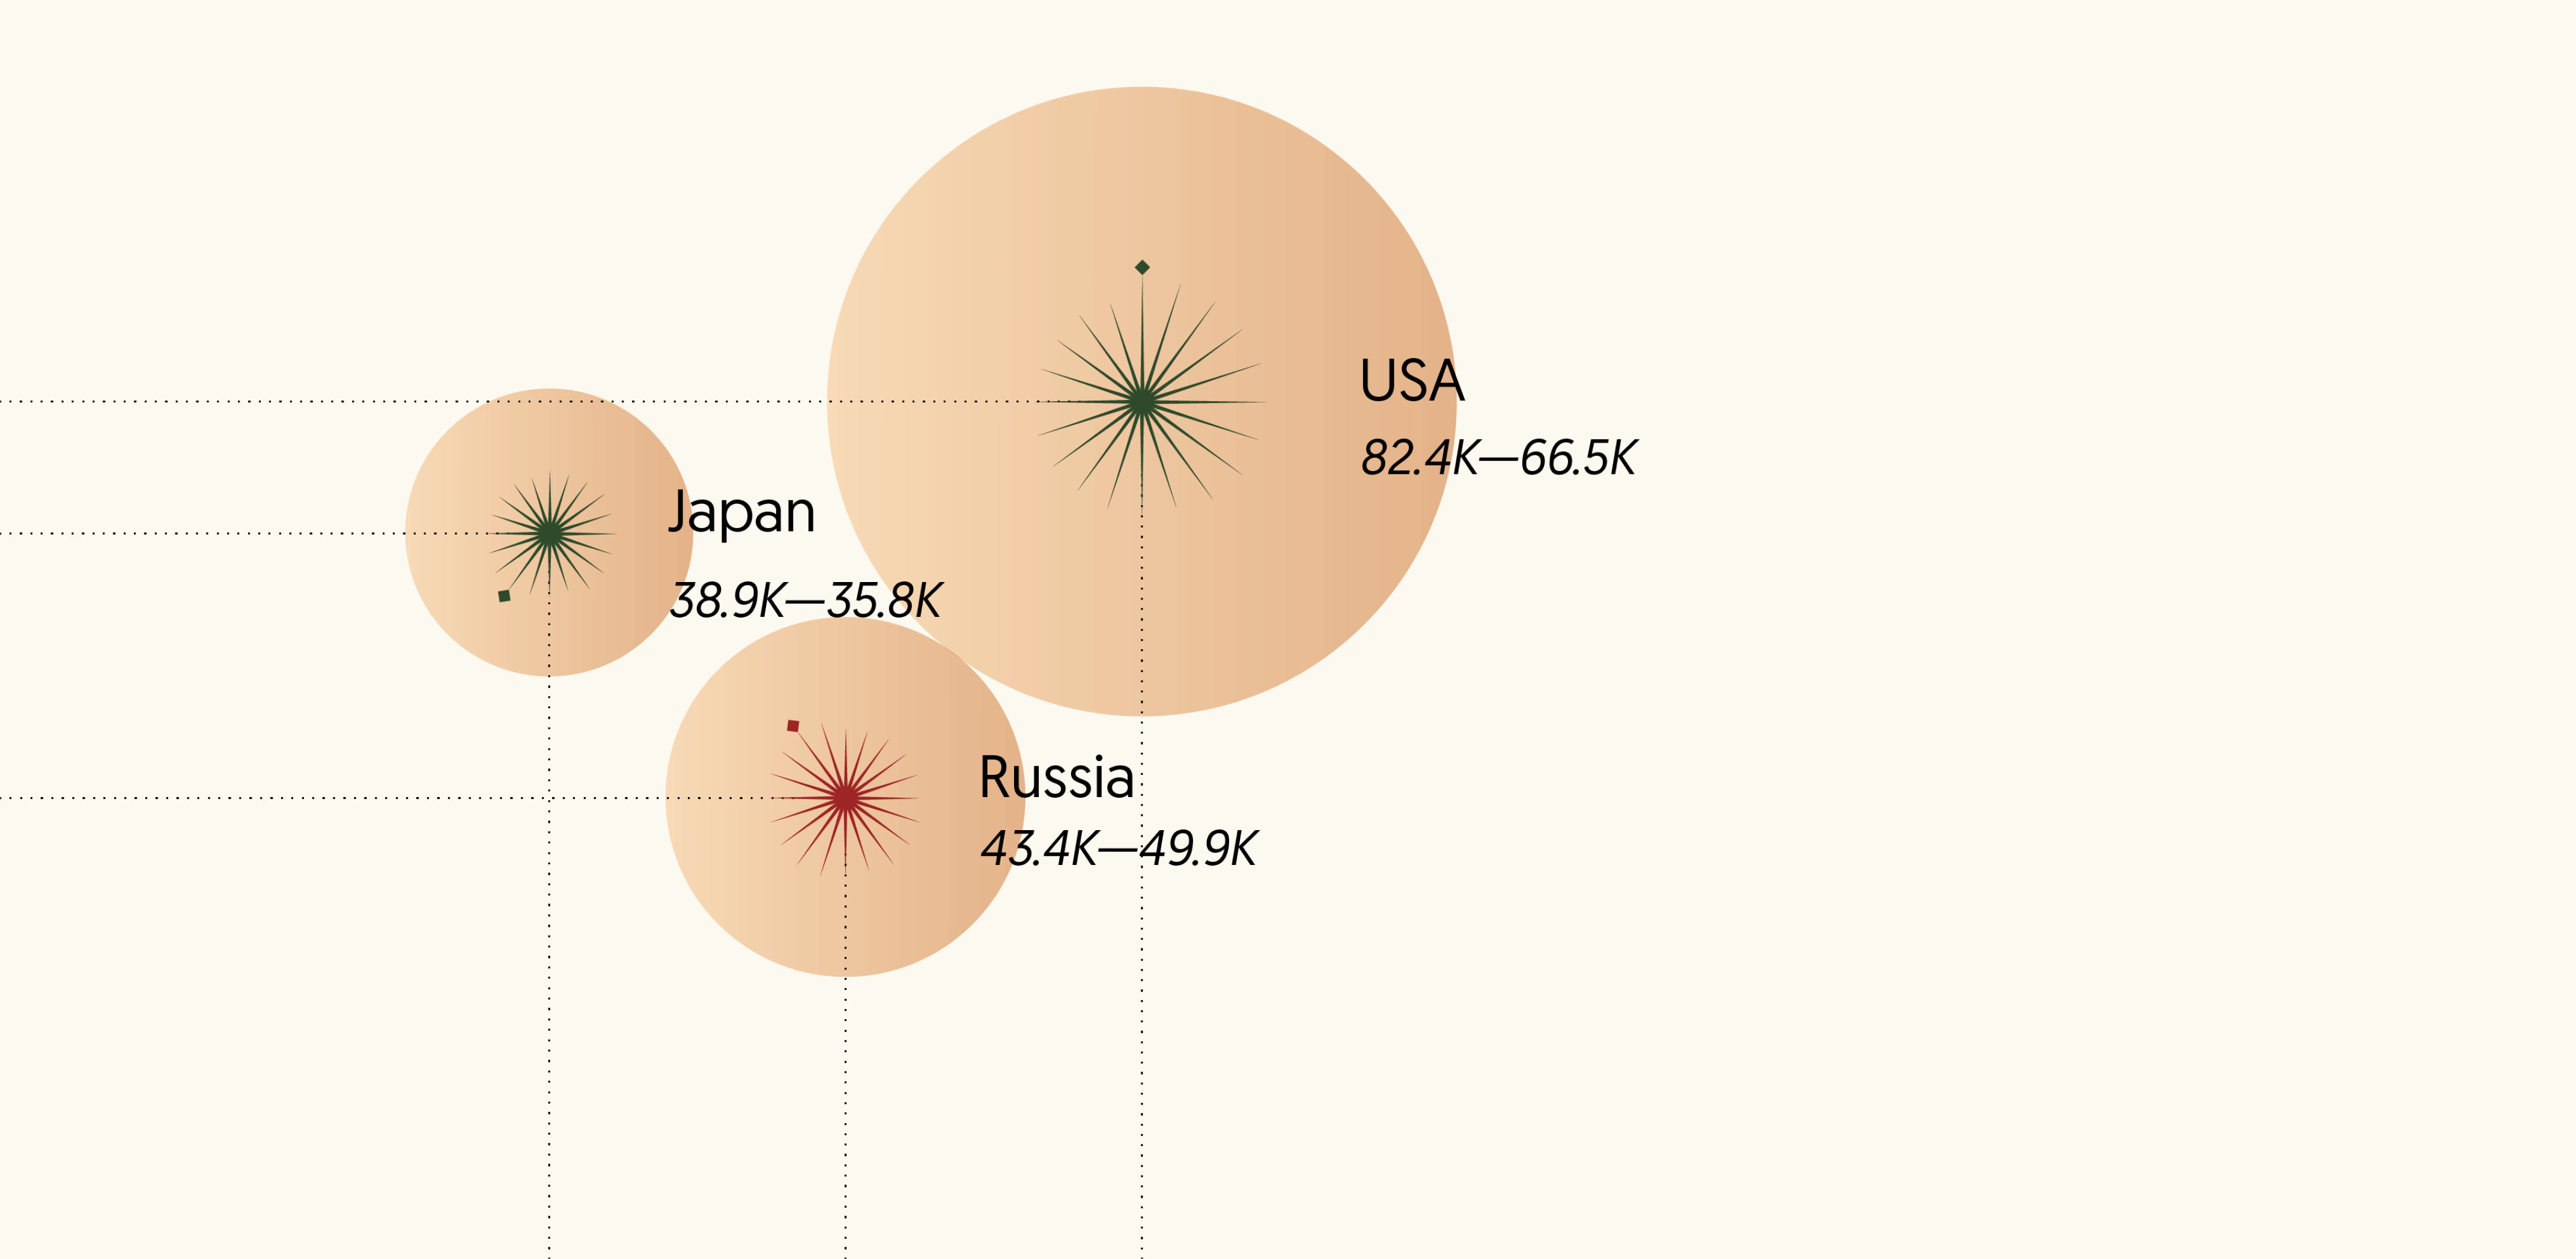
With the emergence of coal shortage and energy crisis in the world, this data visualisation was created to illustrate the fossil fuel energy consumption per capita in countries with a population of more than 5 million.
Colour Exploration
A series of studies exploring colour as the subject in itself. Palettes, gradients and combinations are composed as standalone pieces, observing how colours shift in character when placed next to one another.




Landscapes
A series of illustrated landscapes drawn as quiet, minimal scenes. Studies in light, depth and mood that reduce each place to its essential shapes and colours.




Ad Explorations
A set of short motion explorations for advertising. Quick looping ideas that test how much a single, simple movement can communicate.
Roller Coaster
A continuation of the Fun World series, these loop animations recreate the roller coaster. The slow climb, the sudden drop, and the rhythm of a ride that endlessly repeats itself.
My Month in Numbers 2
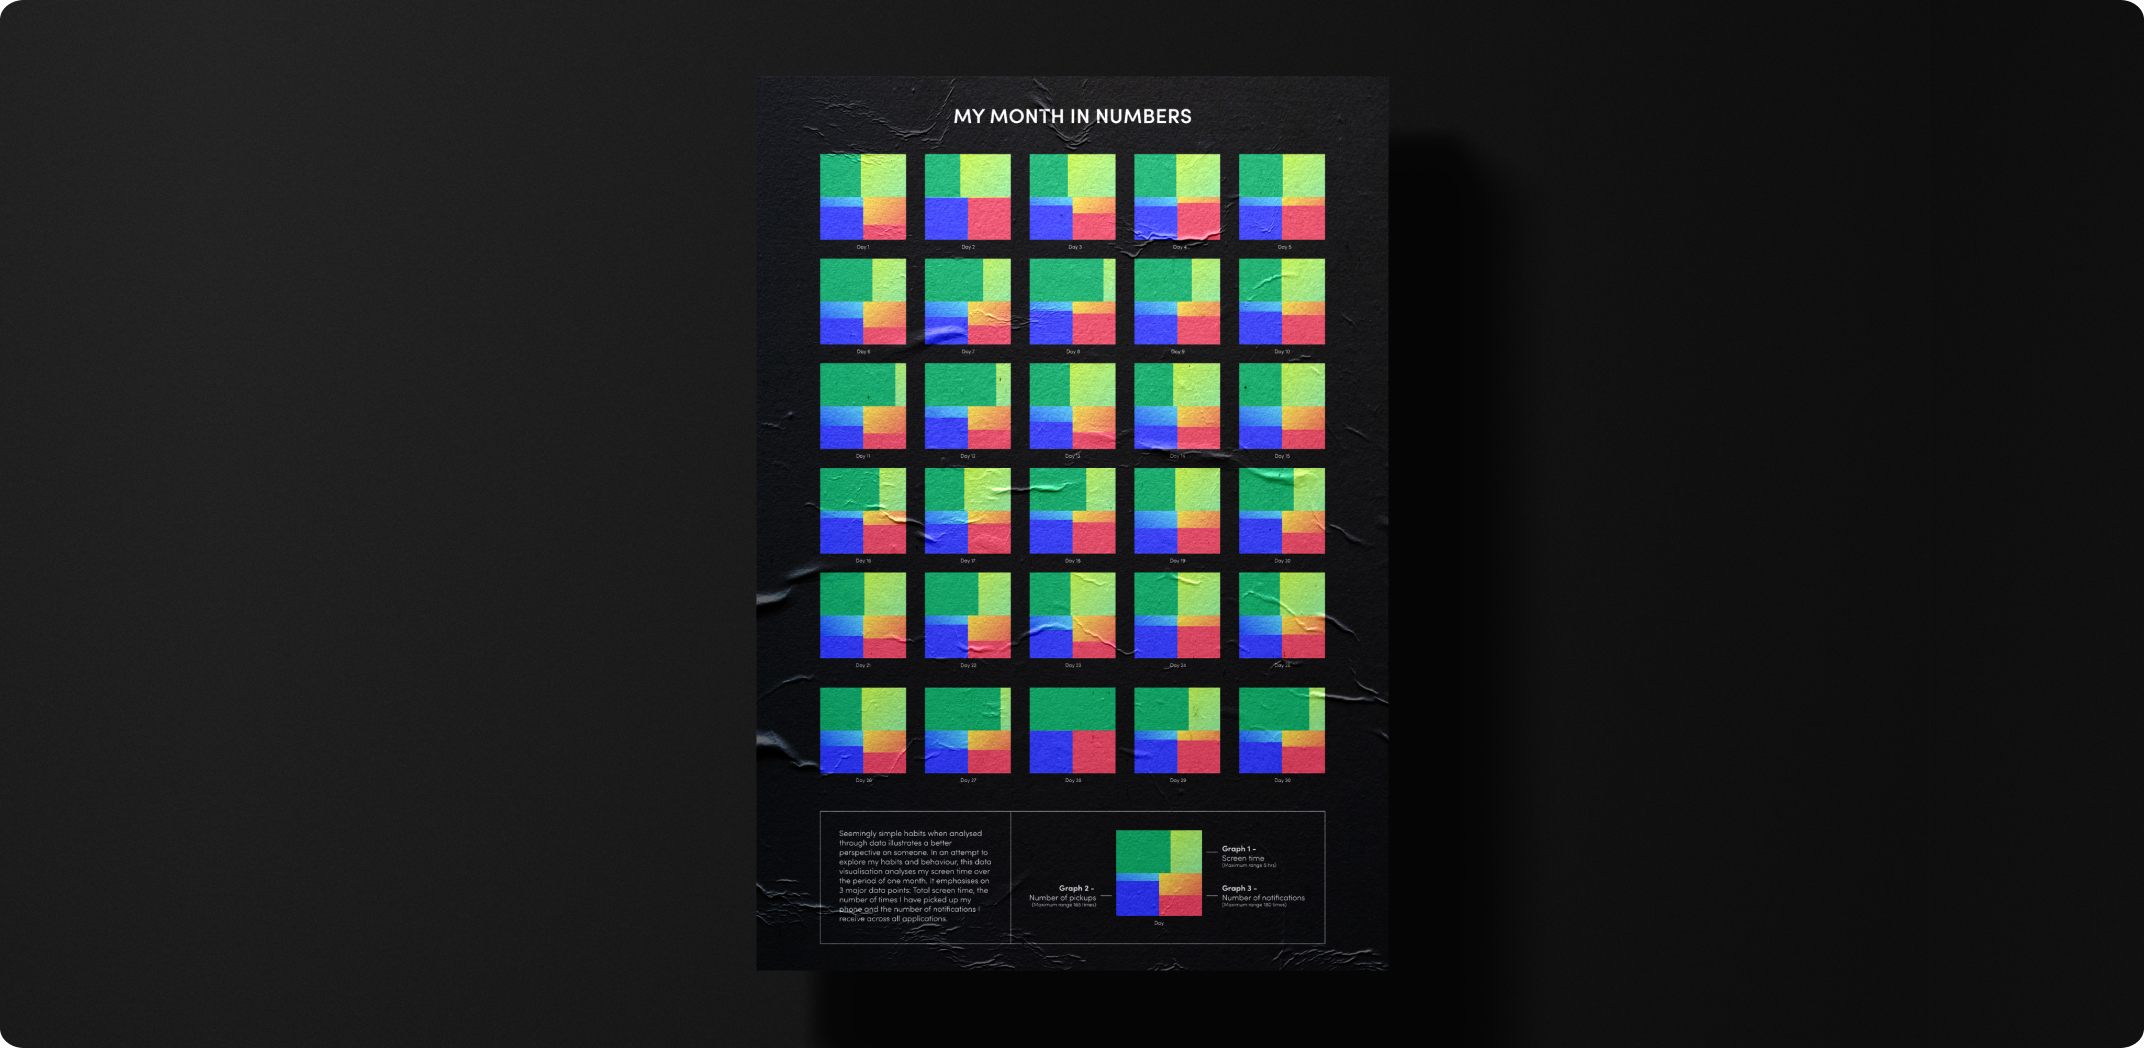
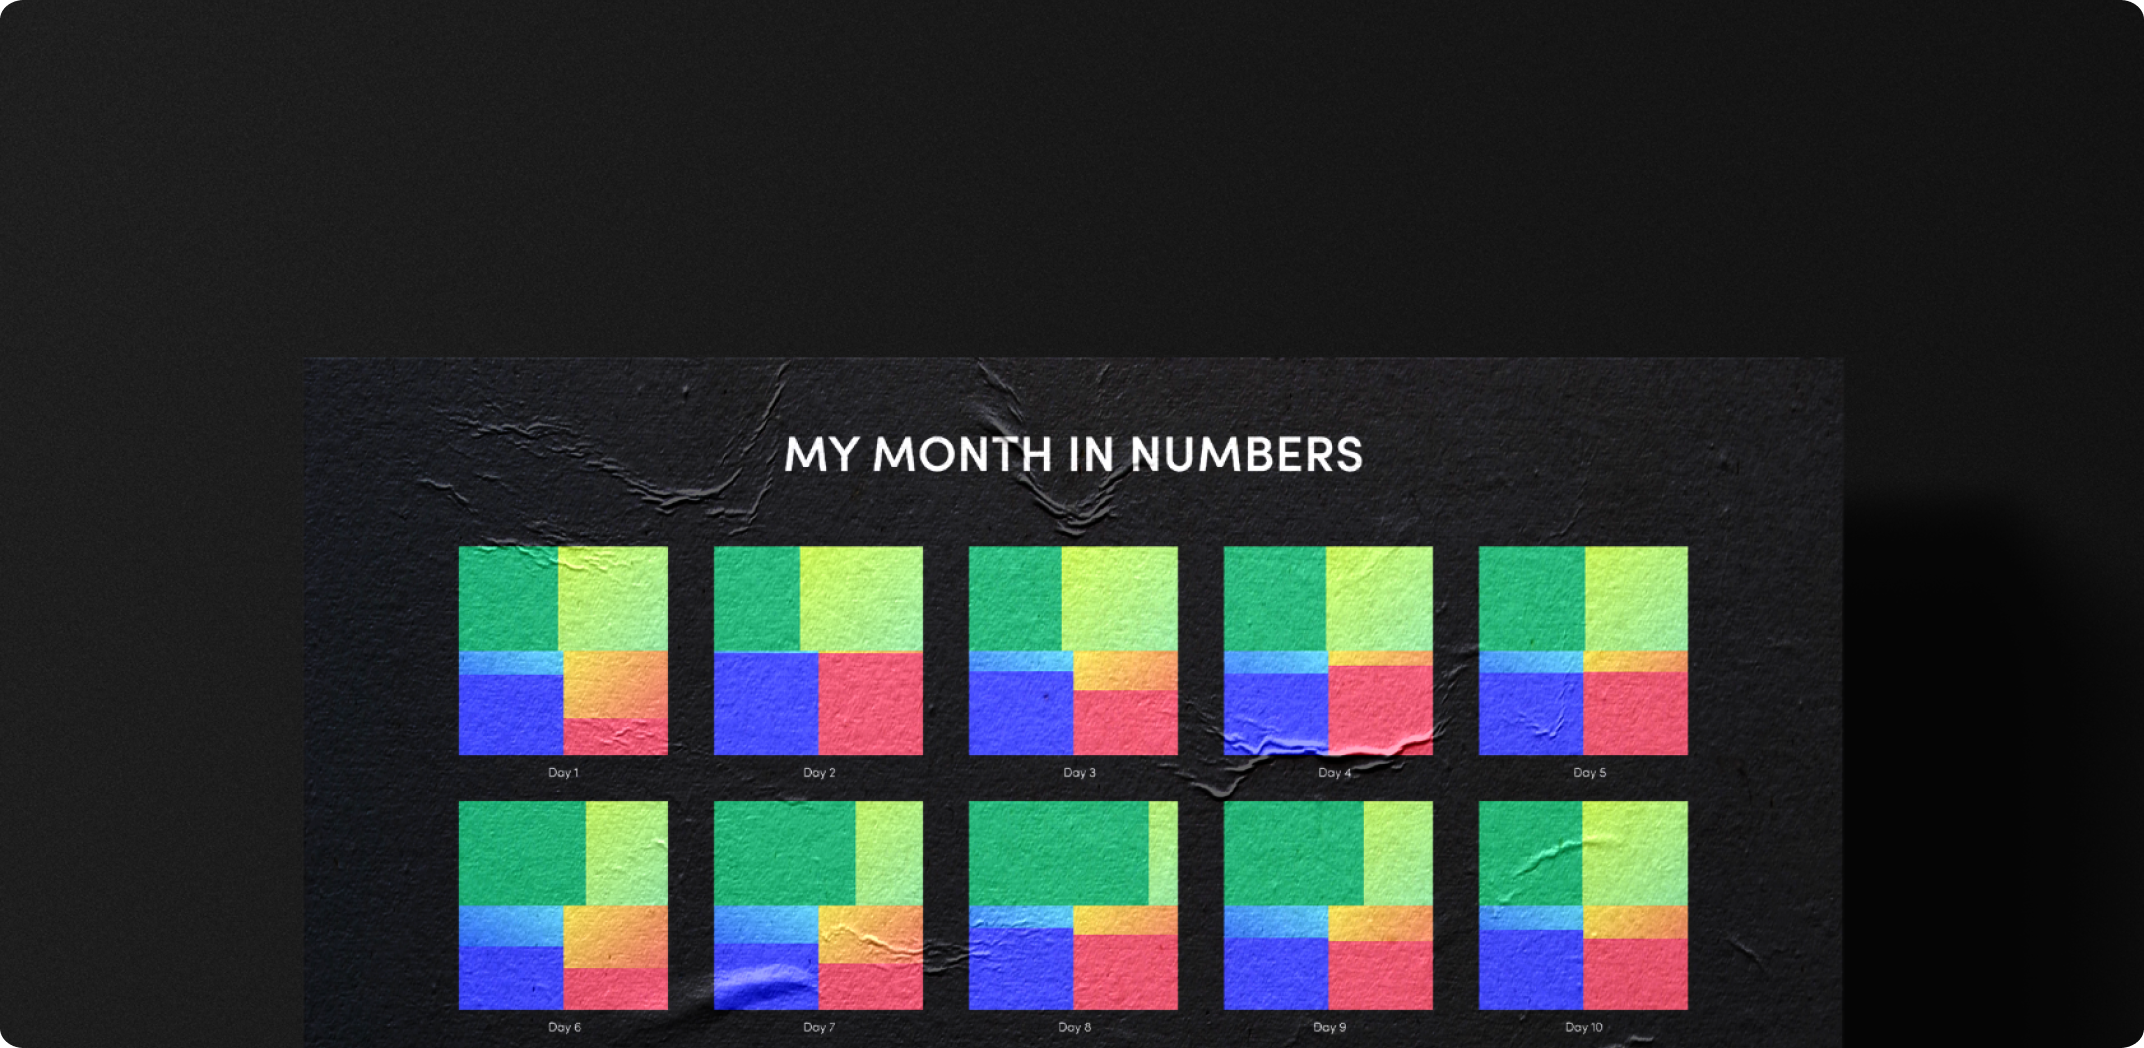
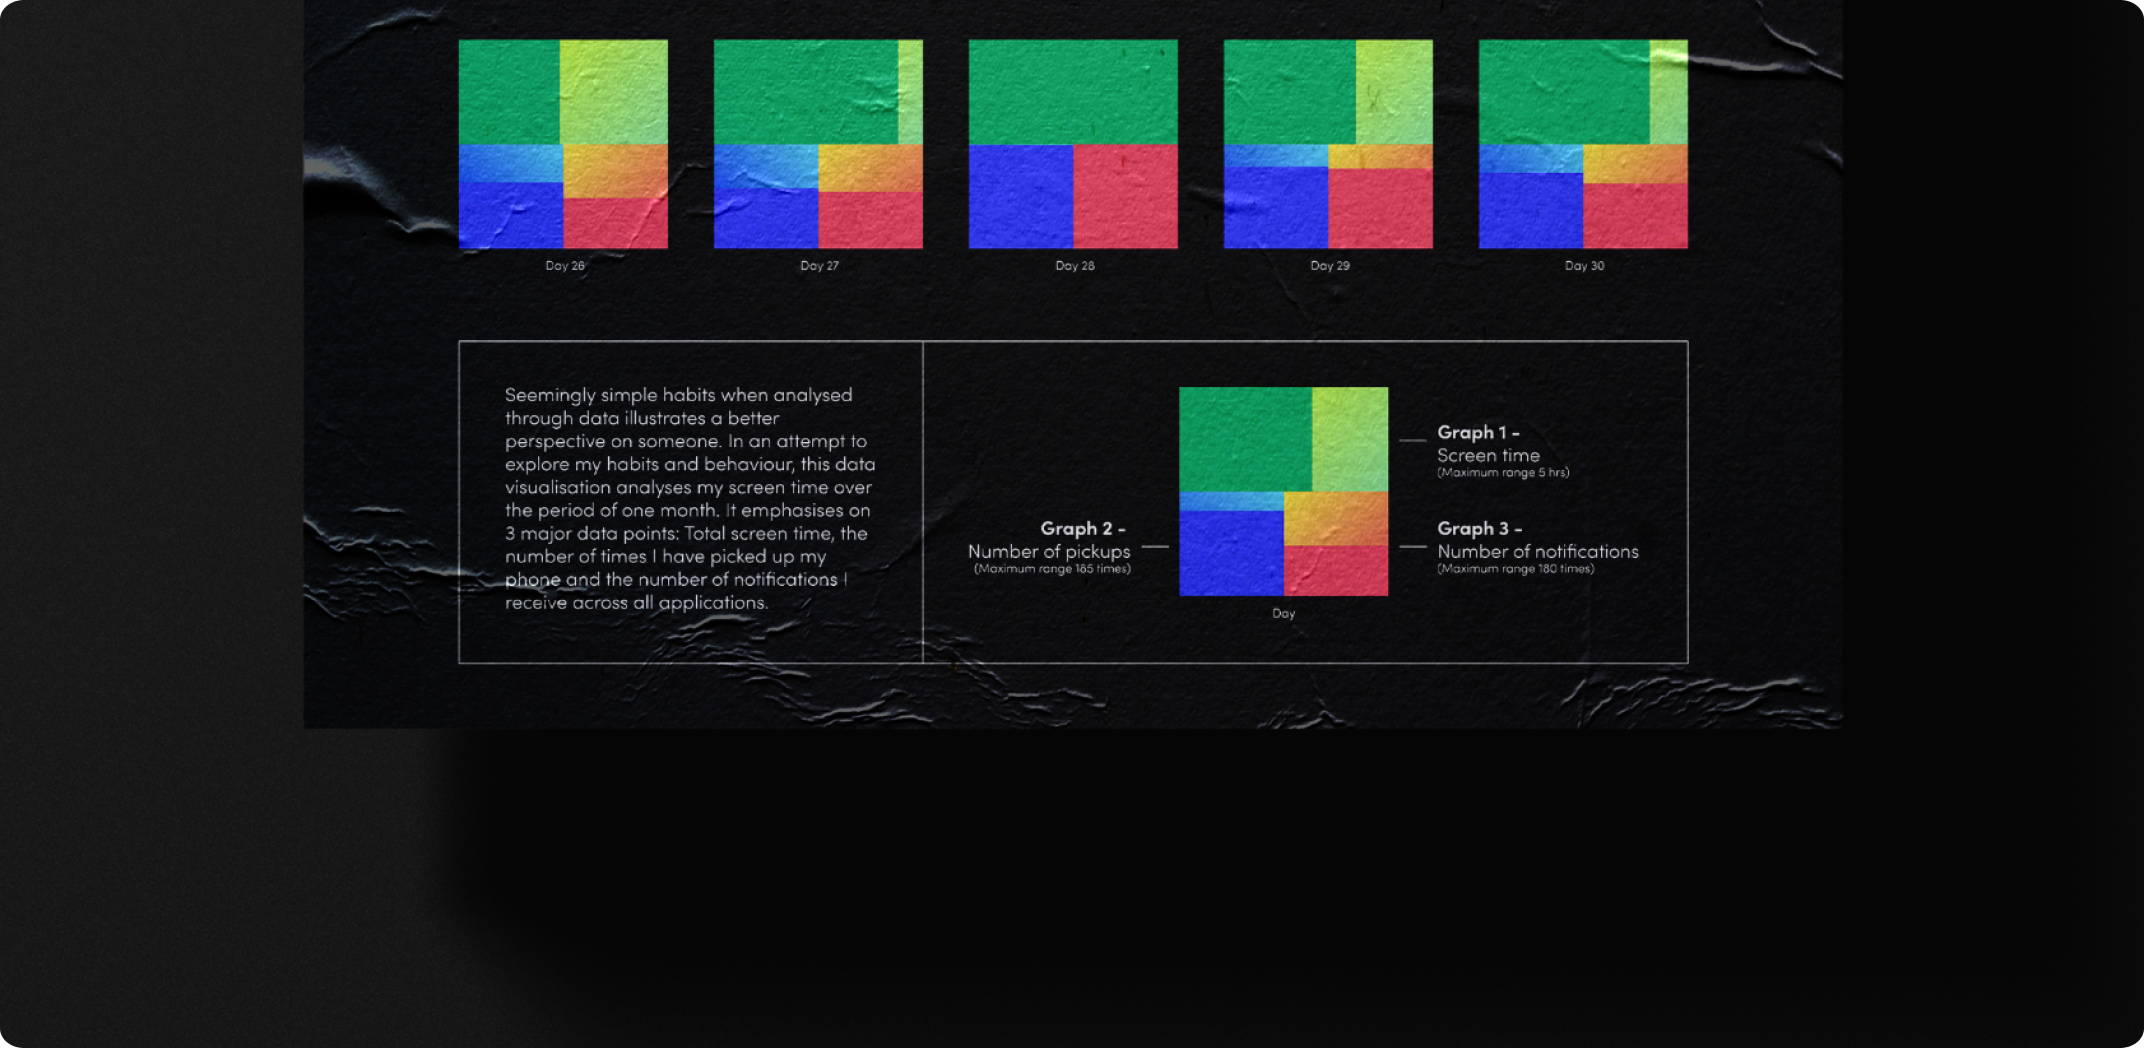
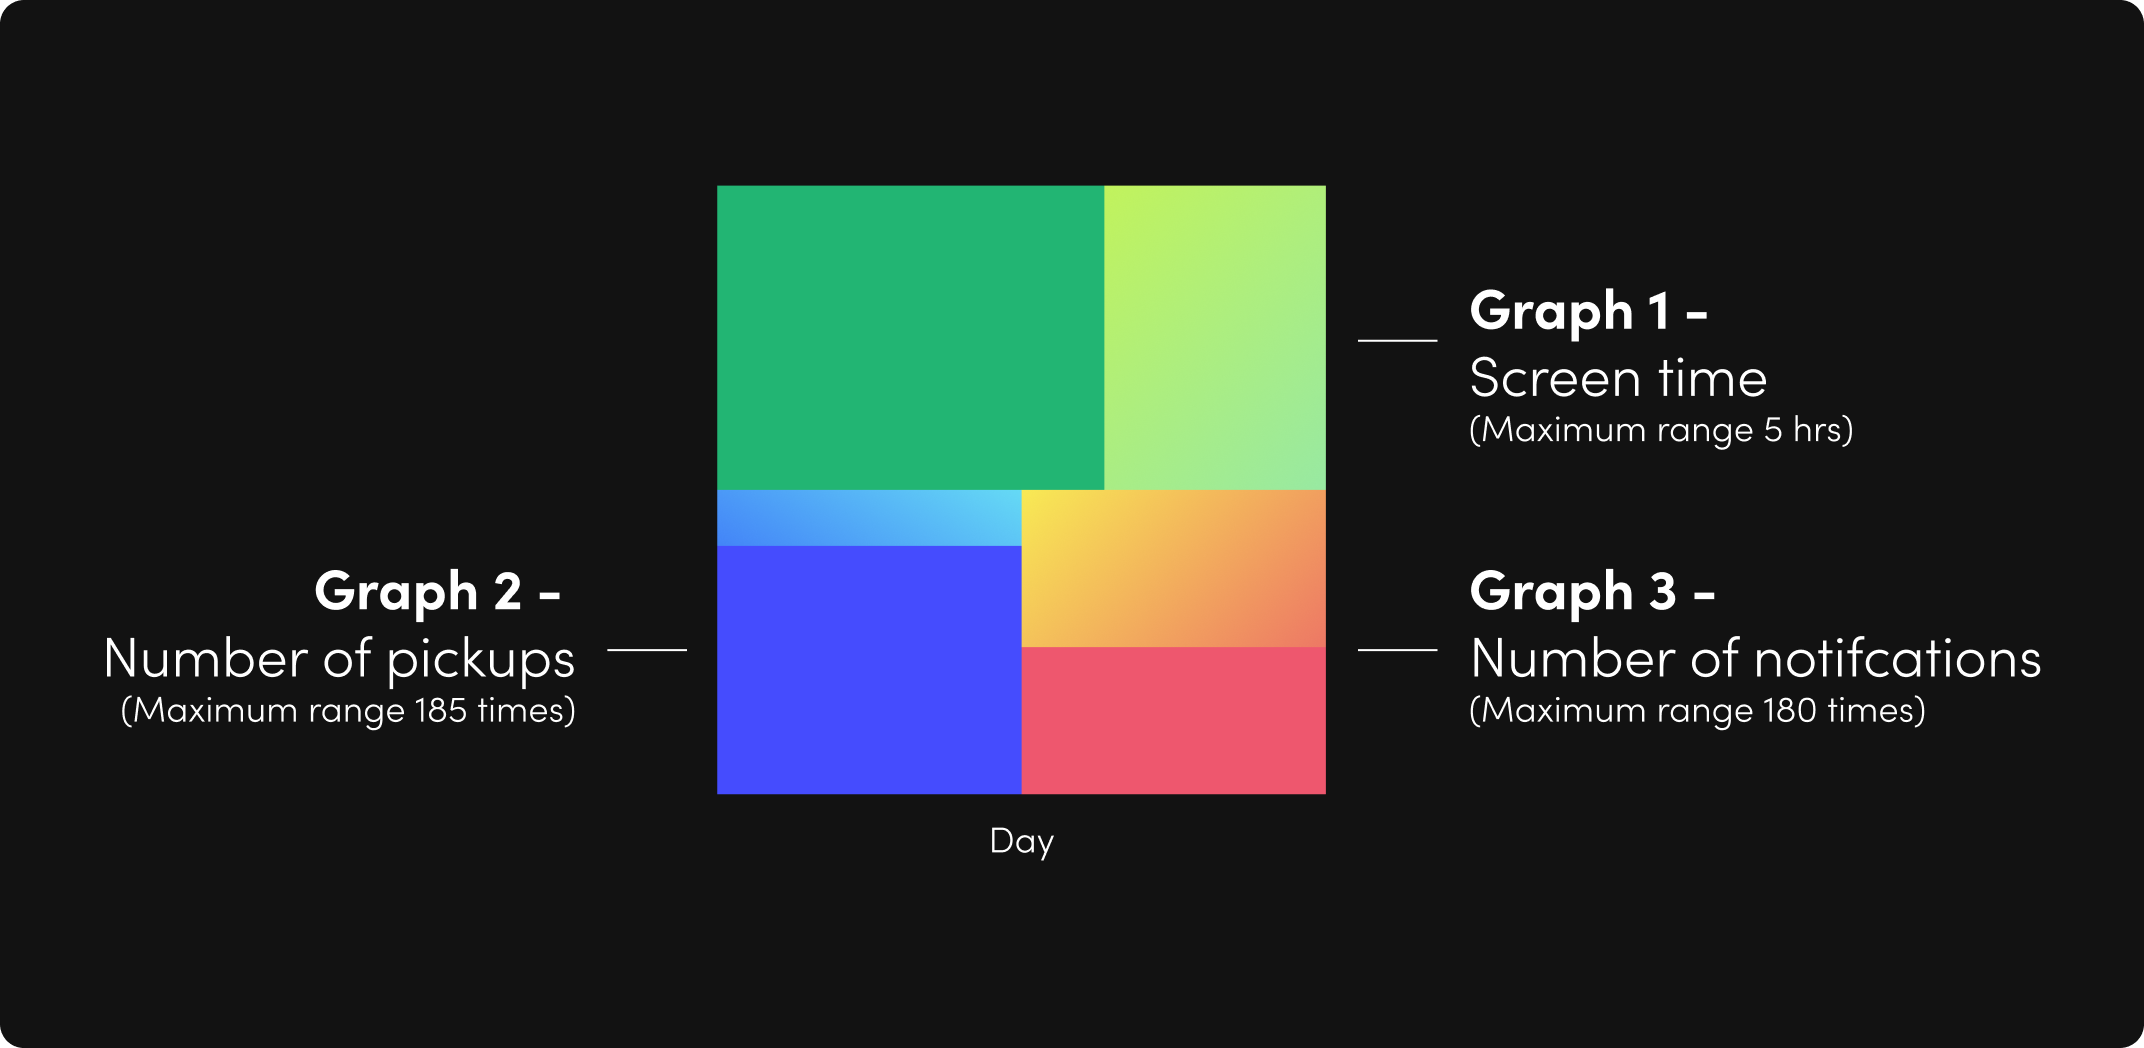
Seemingly simple habits, when analysed through data, illustrate a better perspective on someone. In an attempt to explore my habits and behaviour, this data visualisation analyses my screen time over the period of one month. It emphasises 3 major data points: total screen time, the number of times I have picked up my phone and the number of notifications I receive across all applications.